🎉 Start Shopify’s $1 Plan and We’ll pay you up to $3,600 just for starting! 💸 — Limited Time
Get Limited Time Offer 💰
Offer Details — Rewards require completing eligible third-party offers. Reward amounts vary from $30 to $3,600. Terms and eligibility restrictions apply.
🎉 Start Shopify’s $1 Plan and We’ll pay you up to $3,600 just for starting! 💸 — Limited Time
Get Limited Time Offer 💰
Offer Details — Rewards require completing eligible third-party offers. Reward amounts vary from $30 to $3,600. Terms and eligibility restrictions apply.
🎉 Start Shopify’s $1 Plan and We’ll pay you up to $3,600 just for starting! 💸 — Limited Time
Get Limited Time Offer 💰
Offer Details — Rewards require completing eligible third-party offers. Reward amounts vary from $30 to $3,600. Terms and eligibility restrictions apply.
Ecommerce Strategies
Shopify Metrics for Product Page Optimization
Shopify Metrics for Product Page Optimization

When it comes to Shopify product pages, every visitor counts - especially for dropshipping merchants who rely on paid traffic. With global e-commerce conversion rates averaging 2–3%, even a 1% increase in conversions can mean thousands of dollars in extra revenue. To make informed decisions, you need precise metrics that highlight what's working and what isn't.
Shopify's built-in analytics provide a good starting point with tools for tracking sales, traffic, and inventory. However, they fall short on deeper insights like user behavior and advanced attribution. This is where third-party tools come in, offering features like heatmaps, session recordings, and multi-touch attribution models to uncover why visitors leave without buying.
Here’s the takeaway:
Shopify Analytics: Tracks sales, revenue, and inventory but lacks behavioral insights and advanced segmentation.
Third-Party Tools: Offer deeper insights into user behavior, ad performance, and product-specific data but come at a higher cost and require setup.
For smaller stores, Shopify's analytics might suffice. But as your store grows, investing in third-party tools can help you optimize product pages, reduce wasted ad spend, and boost conversions.
I analyzed 983 Shopify product pages, This is What Works!

1. Shopify Built-In Analytics
Shopify's built-in analytics provide merchants with a solid foundation for understanding their store's performance. Offered across all subscription plans, the analytics dashboard covers key metrics like sales, revenue, traffic, and inventory. This setup helps merchants identify obvious issues without immediately needing third-party tools.
Metric Depth
Shopify tracks a variety of metrics, from sales figures by product and SKU variant to average order value (AOV) trends and profit per product (if cost data is entered). On the web performance side, it keeps tabs on Core Web Vitals, including Largest Contentful Paint (LCP), Interaction to Next Paint (INP), and Cumulative Layout Shift (CLS). Shopify considers LCP "Good" at ≤2,500ms, INP at ≤200ms, and CLS at ≤0.1. However, web performance data can lag by up to 36 hours, which limits its usefulness for addressing immediate issues.
"Shopify Analytics works best as a store-level health check. The weakness is at the catalog-intelligence level - which is where most inventory problems hide." - ShelfMerge Guide
Segmentation Options
Shopify allows you to break down data by device type, traffic source, and landing page, as well as differentiate between new and returning customers. For example, if mobile traffic is high but conversions are low, the "Sessions by device" report can help confirm whether the issue is specific to mobile users. That said, more advanced segmentation tools are tied to higher-tier plans. Custom report building is exclusive to the Advanced plan ($399/month), while ShopifyQL Notebooks for raw data queries are only available with Shopify Plus ($2,300+/month).
Operational Insights
Using segmentation data, Shopify also provides operational insights to highlight product trends and challenges. One standout feature is ABC inventory analysis, which grades products based on their revenue contribution: A-grade items generate around 80% of revenue, B-grade accounts for 15%, and C-grade covers the remaining 5%. This makes it easier to prioritize which product pages need attention. Combine this with metrics like sell-through rate and days of inventory remaining, and you can quickly identify what's selling and what isn't. For example, products with over 100 page views but no add-to-cart actions should be reviewed for potential technical issues or barriers to purchase.
2. Third-Party Analytics Tools
Shopify's analytics can tell you a lot about outcomes, but they often fall short when it comes to understanding user behavior. That’s where third-party tools step in. While Shopify data focuses on what happened, these tools dive into the why. This insight is crucial, especially if you're trying to figure out why a product page isn’t converting.
Metric Depth
Shopify's built-in analytics cover key metrics like sales, revenue, and average order value. But third-party tools go deeper, tracking behaviors like scroll depth, time spent on a page, rage clicks, and dead clicks. There's also the issue of data loss due to ad blockers and privacy settings. With about 42.7% of internet users using ad blockers, browser-based tracking alone leaves gaps. Server-side solutions like Elevar (starting at $150/month) and Littledata ($99–$299/month) can get around these limitations, capturing up to 98% of conversion data. These tools offer a much more complete picture compared to pixel-only tracking.
"Shopify Analytics tells you what sold. GA4 tells you where traffic came from. But neither one tells you why 97% of visitors leave without buying." - Clarity Insights
Third-party tools also address a key flaw in Shopify’s default last-click attribution model. This approach often overemphasizes the final touchpoint, ignoring earlier interactions. Tools like Triple Whale ($129–$2,500+/month) offer multi-touch attribution models - such as linear, time-decay, and position-based - that provide a clearer view of how different channels contribute to revenue. For instance, Billy Footwear adopted first-party attribution through LayerFive in 2025, boosting revenue by 36% year-over-year while only increasing ad spend by 7%.
Testing Capabilities
Another advantage of third-party tools is their support for experimentation. Shopify doesn’t have built-in A/B testing, but platforms like GemX allow you to test headlines, button text, images, and layouts. More advanced tools even offer incrementality testing and Media Mix Modeling (MMM) to measure the true impact of changes. This can be a game-changer, especially when you’re spending heavily on ads and need precise attribution data.
Segmentation Options
Third-party analytics tools also shine when it comes to product-level segmentation. They go beyond Shopify’s basic inventory metrics by categorizing products into groups like "Gems" (low traffic, high conversion) or "Bottlenecks" (high traffic, low conversion). For example, one merchant discovered a product with a 12% add-to-cart rate buried on page 3 of a collection. After moving it to the homepage, the product generated an extra $4,000 in monthly revenue.
Operational Insights
These tools don’t just stop at segmentation - they also provide operational insights that Shopify’s dashboard lacks. For instance, platforms like Triple Whale calculate net profit per product by factoring in costs like COGS, ad spend, and shipping. Additionally, engagement scores, which combine metrics like scroll depth and active time on page, let you rank product pages based on how engaging they really are. Tools like Lifetimely ($149–$499+/month) take it a step further with predictive cohort-based LTV modeling. This lets you track how customer value evolves over time - whether it’s 30, 60, or 90 days after acquisition.
Pros and Cons
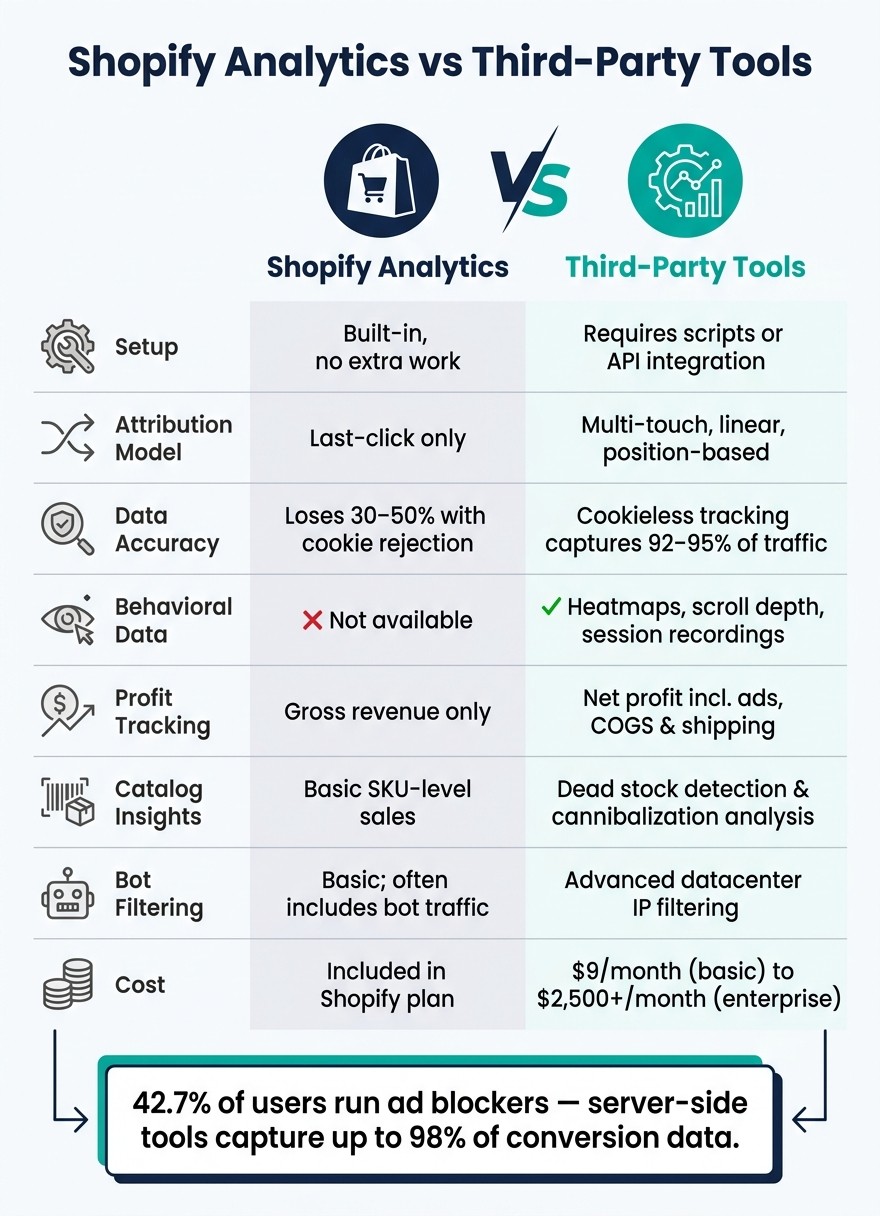
Shopify Analytics vs Third-Party Tools: Feature Comparison
Shopify Analytics and third-party tools each bring their own strengths and weaknesses to the table when it comes to optimizing product pages. Here's a closer look at where they shine and where they might fall short.
Shopify Analytics is ready to go right out of the box. It tracks orders, revenue, and inventory without any extra setup. You get accurate financial data, SKU-level sales reports, and insights into inventory health through metrics like sell-through rates and ABC analysis. This makes it a great tool for quickly assessing your store's overall performance. However, it has its drawbacks. By default, Shopify Analytics relies on a last-click attribution model, which credits only the final touchpoint in a customer’s journey and ignores earlier interactions. Another issue is its dependency on cookies - if users decline consent banners, you could lose 30–50% of visitor data. On top of that, bot traffic (which made up 51% of all web traffic in 2024) can skew session counts and reduce the accuracy of conversion rate reporting. Shopify Analytics also lacks advanced behavioral insights like heatmaps, scroll depth reports, or session recordings.
"Every visitor who declines [cookies] becomes invisible to your Shopify analytics. Their session, their product views, their add-to-cart, their purchase. All gone." - David Karpik, Founder of Clickport Analytics
Third-party tools, on the other hand, fill in many of these gaps by offering behavioral data that Shopify Analytics doesn’t cover. However, they come with their own challenges - higher costs, more complicated setups, and possible impacts on page speed. For instance, combining tools like GA4, GTM, Meta Pixel, and Hotjar can add 400–600KB of JavaScript, potentially slowing down your site and affecting conversions. Another factor to consider is the "analytics tax." If you need custom reports, upgrading from Shopify Basic ($39/month) to Advanced ($399/month) could cost an extra $3,240 annually. Weighing these benefits against the costs is crucial to maximizing your store’s performance.
Here’s a side-by-side comparison of key features:
Feature | Shopify Built-In Analytics | Third-Party Tools |
|---|---|---|
Setup | Built-in, no extra work | Requires additional scripts or API |
Attribution Model | Last-click only | Multi-touch, linear, or position-based |
Data Accuracy | Loses 30–50% with cookie rejection | Cookieless tracking captures 92–95% of traffic |
Behavioral Data | Not available | Includes heatmaps, scroll depth, session recordings |
Profit Tracking | Gross revenue only | Tracks net profit, factoring in costs like ads and shipping |
Catalog Insights | Basic SKU-level sales | Advanced features like dead stock detection and cannibalization analysis |
Bot Filtering | Basic; often includes bot traffic | Advanced filtering for datacenter IPs |
Cost | Included in Shopify plans | Ranges from $9/month (basic tools) to $2,500+/month (enterprise) |
For operational and financial tracking, Shopify Analytics gets the job done. But if you need deeper insights into user behavior or more advanced attribution models - especially for paid ads or a large audience - third-party tools are worth considering.
Conclusion
Shopify's built-in analytics provide a solid starting point - great for tracking orders, revenue, and inventory. But they leave a lot of questions unanswered. As Shopify consultant Marcus Webb explains:
"Shopify's built-in analytics tell you how much you sold today. They don't tell you... why 68% of visitors leave your checkout page."
This highlights the need to align your analytics tools with your store's growth stage.
Here's a simple guide:
Under $50,000/month in revenue: Stick with Shopify's native reports and free tools like Lucky Orange or Report Pundit.
Over $50,000/month: Start investing in profit-tracking tools like Lifetimely or BeProfit.
At $200,000+/month: Consider advanced solutions like server-side tracking and multi-touch attribution tools, such as Triple Whale or Analyzify. These can help you pinpoint where your revenue is really coming from.
For merchants using AI platforms like BuildMyStores to create conversion-ready Shopify stores, analytics are just as crucial as the design itself. Without precise metrics, even the best-built store is operating in the dark. Focusing on metrics like Product Conversion Rate (PCR) at the SKU level, monitoring Core Web Vitals (e.g., LCP under 2.5 seconds, INP under 200ms), and analyzing performance by device can transform a store from guessing to scaling with confidence.
Ultimately, Shopify Analytics is a great tool for financial insights, but adding third-party tools helps you understand customer behavior and attribution. The key is to choose tools that fit your store's current stage of growth.
"The gap between 'having analytics' and 'using the right analytics' is where revenue gets left on the table." - Igor Flyunt, CEO, ObserviX
FAQs
Which Shopify metrics matter most for product pages?
When it comes to Shopify product pages, a few key metrics can make or break your success. These include:
Conversion Rate: This tells you how effectively your product pages turn visitors into paying customers. A higher rate means more sales.
Trust Signals: Elements like reviews, testimonials, and security badges help build confidence in your brand and products.
Product Presentation: High-quality images, detailed descriptions, and even videos can significantly influence buying decisions.
Customer Engagement: Features like Q&A sections or user-generated content (e.g., customer photos) encourage interaction and keep visitors interested.
Ease of Selecting Sizes or Options: A smooth process for choosing variations like size, color, or style can reduce frustration and increase purchases.
These factors play a direct role in how long customers stay on your site and whether they decide to buy.
When should I add third-party analytics tools?
When Shopify's built-in analytics fall short in providing the level of detail, accuracy, or real-time data you’re looking for, it’s worth considering third-party analytics tools. These tools are particularly useful for diving into customer behavior, attribution tracking, or uncovering insights that Shopify’s native reports might not cover. They can give you the extra data you need to make smarter decisions and improve your store’s overall performance.
How do I track product profit, not just revenue?
To get a clear picture of product profit, you need to factor in all costs, including the cost of goods sold (COGS), shipping, fees, and advertising expenses. While entering COGS in Shopify can give you an idea of your gross profit, it doesn’t show the full story.
To calculate net profit, you’ll need to include variable costs like ad spend and shipping. Using profit-tracking tools can simplify this process, giving you a more accurate view of your bottom line. For deeper insights, advanced analytics can break down profitability by acquisition channel and help you understand your overall net profit after every expense is accounted for.
Related Blog Posts
When it comes to Shopify product pages, every visitor counts - especially for dropshipping merchants who rely on paid traffic. With global e-commerce conversion rates averaging 2–3%, even a 1% increase in conversions can mean thousands of dollars in extra revenue. To make informed decisions, you need precise metrics that highlight what's working and what isn't.
Shopify's built-in analytics provide a good starting point with tools for tracking sales, traffic, and inventory. However, they fall short on deeper insights like user behavior and advanced attribution. This is where third-party tools come in, offering features like heatmaps, session recordings, and multi-touch attribution models to uncover why visitors leave without buying.
Here’s the takeaway:
Shopify Analytics: Tracks sales, revenue, and inventory but lacks behavioral insights and advanced segmentation.
Third-Party Tools: Offer deeper insights into user behavior, ad performance, and product-specific data but come at a higher cost and require setup.
For smaller stores, Shopify's analytics might suffice. But as your store grows, investing in third-party tools can help you optimize product pages, reduce wasted ad spend, and boost conversions.
I analyzed 983 Shopify product pages, This is What Works!
1. Shopify Built-In Analytics
Shopify's built-in analytics provide merchants with a solid foundation for understanding their store's performance. Offered across all subscription plans, the analytics dashboard covers key metrics like sales, revenue, traffic, and inventory. This setup helps merchants identify obvious issues without immediately needing third-party tools.
Metric Depth
Shopify tracks a variety of metrics, from sales figures by product and SKU variant to average order value (AOV) trends and profit per product (if cost data is entered). On the web performance side, it keeps tabs on Core Web Vitals, including Largest Contentful Paint (LCP), Interaction to Next Paint (INP), and Cumulative Layout Shift (CLS). Shopify considers LCP "Good" at ≤2,500ms, INP at ≤200ms, and CLS at ≤0.1. However, web performance data can lag by up to 36 hours, which limits its usefulness for addressing immediate issues.
"Shopify Analytics works best as a store-level health check. The weakness is at the catalog-intelligence level - which is where most inventory problems hide." - ShelfMerge Guide
Segmentation Options
Shopify allows you to break down data by device type, traffic source, and landing page, as well as differentiate between new and returning customers. For example, if mobile traffic is high but conversions are low, the "Sessions by device" report can help confirm whether the issue is specific to mobile users. That said, more advanced segmentation tools are tied to higher-tier plans. Custom report building is exclusive to the Advanced plan ($399/month), while ShopifyQL Notebooks for raw data queries are only available with Shopify Plus ($2,300+/month).
Operational Insights
Using segmentation data, Shopify also provides operational insights to highlight product trends and challenges. One standout feature is ABC inventory analysis, which grades products based on their revenue contribution: A-grade items generate around 80% of revenue, B-grade accounts for 15%, and C-grade covers the remaining 5%. This makes it easier to prioritize which product pages need attention. Combine this with metrics like sell-through rate and days of inventory remaining, and you can quickly identify what's selling and what isn't. For example, products with over 100 page views but no add-to-cart actions should be reviewed for potential technical issues or barriers to purchase.
2. Third-Party Analytics Tools
Shopify's analytics can tell you a lot about outcomes, but they often fall short when it comes to understanding user behavior. That’s where third-party tools step in. While Shopify data focuses on what happened, these tools dive into the why. This insight is crucial, especially if you're trying to figure out why a product page isn’t converting.
Metric Depth
Shopify's built-in analytics cover key metrics like sales, revenue, and average order value. But third-party tools go deeper, tracking behaviors like scroll depth, time spent on a page, rage clicks, and dead clicks. There's also the issue of data loss due to ad blockers and privacy settings. With about 42.7% of internet users using ad blockers, browser-based tracking alone leaves gaps. Server-side solutions like Elevar (starting at $150/month) and Littledata ($99–$299/month) can get around these limitations, capturing up to 98% of conversion data. These tools offer a much more complete picture compared to pixel-only tracking.
"Shopify Analytics tells you what sold. GA4 tells you where traffic came from. But neither one tells you why 97% of visitors leave without buying." - Clarity Insights
Third-party tools also address a key flaw in Shopify’s default last-click attribution model. This approach often overemphasizes the final touchpoint, ignoring earlier interactions. Tools like Triple Whale ($129–$2,500+/month) offer multi-touch attribution models - such as linear, time-decay, and position-based - that provide a clearer view of how different channels contribute to revenue. For instance, Billy Footwear adopted first-party attribution through LayerFive in 2025, boosting revenue by 36% year-over-year while only increasing ad spend by 7%.
Testing Capabilities
Another advantage of third-party tools is their support for experimentation. Shopify doesn’t have built-in A/B testing, but platforms like GemX allow you to test headlines, button text, images, and layouts. More advanced tools even offer incrementality testing and Media Mix Modeling (MMM) to measure the true impact of changes. This can be a game-changer, especially when you’re spending heavily on ads and need precise attribution data.
Segmentation Options
Third-party analytics tools also shine when it comes to product-level segmentation. They go beyond Shopify’s basic inventory metrics by categorizing products into groups like "Gems" (low traffic, high conversion) or "Bottlenecks" (high traffic, low conversion). For example, one merchant discovered a product with a 12% add-to-cart rate buried on page 3 of a collection. After moving it to the homepage, the product generated an extra $4,000 in monthly revenue.
Operational Insights
These tools don’t just stop at segmentation - they also provide operational insights that Shopify’s dashboard lacks. For instance, platforms like Triple Whale calculate net profit per product by factoring in costs like COGS, ad spend, and shipping. Additionally, engagement scores, which combine metrics like scroll depth and active time on page, let you rank product pages based on how engaging they really are. Tools like Lifetimely ($149–$499+/month) take it a step further with predictive cohort-based LTV modeling. This lets you track how customer value evolves over time - whether it’s 30, 60, or 90 days after acquisition.
Pros and Cons
Shopify Analytics vs Third-Party Tools: Feature Comparison
Shopify Analytics and third-party tools each bring their own strengths and weaknesses to the table when it comes to optimizing product pages. Here's a closer look at where they shine and where they might fall short.
Shopify Analytics is ready to go right out of the box. It tracks orders, revenue, and inventory without any extra setup. You get accurate financial data, SKU-level sales reports, and insights into inventory health through metrics like sell-through rates and ABC analysis. This makes it a great tool for quickly assessing your store's overall performance. However, it has its drawbacks. By default, Shopify Analytics relies on a last-click attribution model, which credits only the final touchpoint in a customer’s journey and ignores earlier interactions. Another issue is its dependency on cookies - if users decline consent banners, you could lose 30–50% of visitor data. On top of that, bot traffic (which made up 51% of all web traffic in 2024) can skew session counts and reduce the accuracy of conversion rate reporting. Shopify Analytics also lacks advanced behavioral insights like heatmaps, scroll depth reports, or session recordings.
"Every visitor who declines [cookies] becomes invisible to your Shopify analytics. Their session, their product views, their add-to-cart, their purchase. All gone." - David Karpik, Founder of Clickport Analytics
Third-party tools, on the other hand, fill in many of these gaps by offering behavioral data that Shopify Analytics doesn’t cover. However, they come with their own challenges - higher costs, more complicated setups, and possible impacts on page speed. For instance, combining tools like GA4, GTM, Meta Pixel, and Hotjar can add 400–600KB of JavaScript, potentially slowing down your site and affecting conversions. Another factor to consider is the "analytics tax." If you need custom reports, upgrading from Shopify Basic ($39/month) to Advanced ($399/month) could cost an extra $3,240 annually. Weighing these benefits against the costs is crucial to maximizing your store’s performance.
Here’s a side-by-side comparison of key features:
Feature | Shopify Built-In Analytics | Third-Party Tools |
|---|---|---|
Setup | Built-in, no extra work | Requires additional scripts or API |
Attribution Model | Last-click only | Multi-touch, linear, or position-based |
Data Accuracy | Loses 30–50% with cookie rejection | Cookieless tracking captures 92–95% of traffic |
Behavioral Data | Not available | Includes heatmaps, scroll depth, session recordings |
Profit Tracking | Gross revenue only | Tracks net profit, factoring in costs like ads and shipping |
Catalog Insights | Basic SKU-level sales | Advanced features like dead stock detection and cannibalization analysis |
Bot Filtering | Basic; often includes bot traffic | Advanced filtering for datacenter IPs |
Cost | Included in Shopify plans | Ranges from $9/month (basic tools) to $2,500+/month (enterprise) |
For operational and financial tracking, Shopify Analytics gets the job done. But if you need deeper insights into user behavior or more advanced attribution models - especially for paid ads or a large audience - third-party tools are worth considering.
Conclusion
Shopify's built-in analytics provide a solid starting point - great for tracking orders, revenue, and inventory. But they leave a lot of questions unanswered. As Shopify consultant Marcus Webb explains:
"Shopify's built-in analytics tell you how much you sold today. They don't tell you... why 68% of visitors leave your checkout page."
This highlights the need to align your analytics tools with your store's growth stage.
Here's a simple guide:
Under $50,000/month in revenue: Stick with Shopify's native reports and free tools like Lucky Orange or Report Pundit.
Over $50,000/month: Start investing in profit-tracking tools like Lifetimely or BeProfit.
At $200,000+/month: Consider advanced solutions like server-side tracking and multi-touch attribution tools, such as Triple Whale or Analyzify. These can help you pinpoint where your revenue is really coming from.
For merchants using AI platforms like BuildMyStores to create conversion-ready Shopify stores, analytics are just as crucial as the design itself. Without precise metrics, even the best-built store is operating in the dark. Focusing on metrics like Product Conversion Rate (PCR) at the SKU level, monitoring Core Web Vitals (e.g., LCP under 2.5 seconds, INP under 200ms), and analyzing performance by device can transform a store from guessing to scaling with confidence.
Ultimately, Shopify Analytics is a great tool for financial insights, but adding third-party tools helps you understand customer behavior and attribution. The key is to choose tools that fit your store's current stage of growth.
"The gap between 'having analytics' and 'using the right analytics' is where revenue gets left on the table." - Igor Flyunt, CEO, ObserviX
FAQs
Which Shopify metrics matter most for product pages?
When it comes to Shopify product pages, a few key metrics can make or break your success. These include:
Conversion Rate: This tells you how effectively your product pages turn visitors into paying customers. A higher rate means more sales.
Trust Signals: Elements like reviews, testimonials, and security badges help build confidence in your brand and products.
Product Presentation: High-quality images, detailed descriptions, and even videos can significantly influence buying decisions.
Customer Engagement: Features like Q&A sections or user-generated content (e.g., customer photos) encourage interaction and keep visitors interested.
Ease of Selecting Sizes or Options: A smooth process for choosing variations like size, color, or style can reduce frustration and increase purchases.
These factors play a direct role in how long customers stay on your site and whether they decide to buy.
When should I add third-party analytics tools?
When Shopify's built-in analytics fall short in providing the level of detail, accuracy, or real-time data you’re looking for, it’s worth considering third-party analytics tools. These tools are particularly useful for diving into customer behavior, attribution tracking, or uncovering insights that Shopify’s native reports might not cover. They can give you the extra data you need to make smarter decisions and improve your store’s overall performance.
How do I track product profit, not just revenue?
To get a clear picture of product profit, you need to factor in all costs, including the cost of goods sold (COGS), shipping, fees, and advertising expenses. While entering COGS in Shopify can give you an idea of your gross profit, it doesn’t show the full story.
To calculate net profit, you’ll need to include variable costs like ad spend and shipping. Using profit-tracking tools can simplify this process, giving you a more accurate view of your bottom line. For deeper insights, advanced analytics can break down profitability by acquisition channel and help you understand your overall net profit after every expense is accounted for.
Related Blog Posts
Get your store!
© 2025 BuildMyStores
© 2025 BuildMyStores