🎉 Start Shopify’s $1 Plan and We’ll pay you up to $3,600 just for starting! 💸 — Limited Time
Get Limited Time Offer 💰
Offer Details — Rewards require completing eligible third-party offers. Reward amounts vary from $30 to $3,600. Terms and eligibility restrictions apply.
🎉 Start Shopify’s $1 Plan and We’ll pay you up to $3,600 just for starting! 💸 — Limited Time
Get Limited Time Offer 💰
Offer Details — Rewards require completing eligible third-party offers. Reward amounts vary from $30 to $3,600. Terms and eligibility restrictions apply.
🎉 Start Shopify’s $1 Plan and We’ll pay you up to $3,600 just for starting! 💸 — Limited Time
Get Limited Time Offer 💰
Offer Details — Rewards require completing eligible third-party offers. Reward amounts vary from $30 to $3,600. Terms and eligibility restrictions apply.
Ecommerce Strategies
How To Analyze Customer Behavior For Shopify Stores
How To Analyze Customer Behavior For Shopify Stores

Analyzing customer behavior is the key to improving your Shopify store’s performance. It helps you understand how visitors interact with your site, why they abandon carts, and what drives their purchases. By tracking metrics like traffic sources, session duration, and conversion funnels, you can identify problem areas and make data-driven improvements. Using tools like Shopify Analytics, Google Analytics, heatmaps, and session recordings, you can refine your store's design, optimize checkout processes, and create tailored marketing campaigns. Here’s how you can start:
Traffic Sources: Identify where visitors come from (organic search, ads, social media) and which channels convert best.
Session Duration & Bounce Rate: Measure engagement and spot pages that need better content or design.
Conversion Funnels: Track where users drop off in the buying process and simplify those steps.
Customer Lifetime Value (CLV): Understand how much revenue each customer brings over time to guide your marketing spend.
Heatmaps & Session Recordings: Visualize user interactions to find usability issues or areas for improvement.
Customer Segmentation: Group customers based on behavior (e.g., frequent buyers vs. at-risk customers) for targeted strategies.
Shopify Analytics 2025 Full Tutorial - Understand Your Data To Scale With Ease

Key Customer Behavior Metrics to Track
Tracking key customer behavior metrics can give you a clearer picture of what your customers are doing, why they’re doing it, and where there’s room for improvement.
Traffic Sources and User Navigation
Traffic sources reveal where your customers are coming from - whether it’s organic search, paid ads, social media, or referral links. This information helps pinpoint which marketing channels bring in engaged visitors who are more likely to convert. For instance, a high bounce rate from social media traffic might mean your ad messaging doesn’t align with the landing page. On the other hand, strong conversions from organic search suggest your SEO is effectively targeting the right audience.
User navigation paths show how visitors move through your store. They highlight which pages drive engagement, where users drop off, and which pages lead to purchases. For example, if many users leave after landing on a specific category page, it could mean the page needs clearer calls to action or better product organization.
Next, let’s dive into session duration and bounce rate to measure how well your site keeps visitors engaged.
Session Duration and Bounce Rate
Session duration measures how long visitors stay on your site, while bounce rate shows the percentage of users who leave after viewing just one page. Together, these metrics paint a picture of how engaging and relevant your content is. For Shopify stores, session durations typically range from 2 to 4 minutes, with longer sessions often tied to higher conversion rates. Bounce rates for e-commerce sites generally fall between 20% and 45%.
A high bounce rate isn’t always a bad thing - sometimes users find what they need right away. However, consistently high bounce rates on key pages often signal problems with relevance or user experience. For example, if a paid traffic landing page has a high bounce rate, testing new layouts, messaging, or calls to action can help improve performance.
Now, let’s look at conversion funnels and customer lifetime value to better understand revenue-generating behaviors.
Conversion Funnels and Customer Lifetime Value
Conversion funnels map out a visitor’s journey from their first click to completing a purchase. A typical funnel might include steps like homepage → product page → add to cart → checkout → purchase. By analyzing where visitors drop off at each stage, you can identify specific areas to improve. For example, many Shopify stores see conversion rates between 1.4% and 2.5%, with top performers exceeding 3%. High drop-off rates often point to issues like a complicated checkout process, unexpected shipping costs, or unclear product details.
Customer Lifetime Value (CLV) estimates the total revenue a customer is likely to generate over their relationship with your store. It’s calculated by multiplying the average purchase value, purchase frequency, and customer lifespan. For example, a customer who spends $50 per order, shops twice a year, and stays loyal for three years has a CLV of $300. Knowing your CLV can help you decide how much to invest in acquiring and retaining customers. After all, returning customers can contribute up to 40% of your store’s revenue.
Tracking these metrics gives you the insights needed to make smarter, data-driven decisions. Together, they provide a well-rounded view of how effectively your store engages visitors and turns them into loyal customers.
Using Shopify's Built-In Analytics
Shopify offers a built-in analytics dashboard that simplifies tracking customer behavior. With tools for monitoring real-time sales, traffic, sessions, and product views, it’s designed to be intuitive and accessible - even for those without technical expertise.
Accessing Shopify Analytics Dashboard
To get started, log in to your Shopify admin panel and select "Analytics" from the left sidebar. The dashboard is organized into three main sections: Overview, Reports, and Live View. These sections provide a clear snapshot of key metrics like product views, sessions, and conversion rates.
Overview: Displays essential metrics - total sales, sessions, and conversion rates - over a selected time period. Dates are shown in the MM/DD/YYYY format, and values are presented in U.S. dollars ($).
Reports: Offers deeper insights into customer behavior, sales attribution, and traffic sources.
Live View: Shows real-time data, including the number of visitors and ongoing sales.
For BuildMyStores users, conversion tracking is already optimized, so you can dive straight into analyzing your store’s performance.
Reading Customer Behavior Reports
Shopify's customer behavior reports focus on critical areas like product views, sessions, and abandoned carts, helping you understand how customers interact with your store.
Product Views: Identify which items are performing well and which might need adjustments, such as improved descriptions, better images, or competitive pricing.
Sessions: Track how visitors navigate your site and how long they stay. You can segment this data by customer type - first-time visitors versus returning customers - to refine your marketing strategies and retention efforts.
Abandoned Carts: This report is invaluable for spotting issues in the checkout process. For example, if cart abandonment increases after shipping costs are revealed, you might consider offering free shipping or displaying shipping details earlier. A spike at the payment stage could indicate problems with payment options or concerns about security.
These reports also highlight conversion trends by traffic source. For instance, you might discover that visitors from organic search convert more frequently than those from social media. Such insights can guide you in addressing specific problem areas.
Shopify formats all data for U.S. merchants, using commas for thousand separators, periods for decimals, and standard U.S. time zones for time-based reports. This consistent formatting makes it easier to align analytics data with your marketing efforts and overall business operations.
Setting Up Google Analytics for Better Tracking
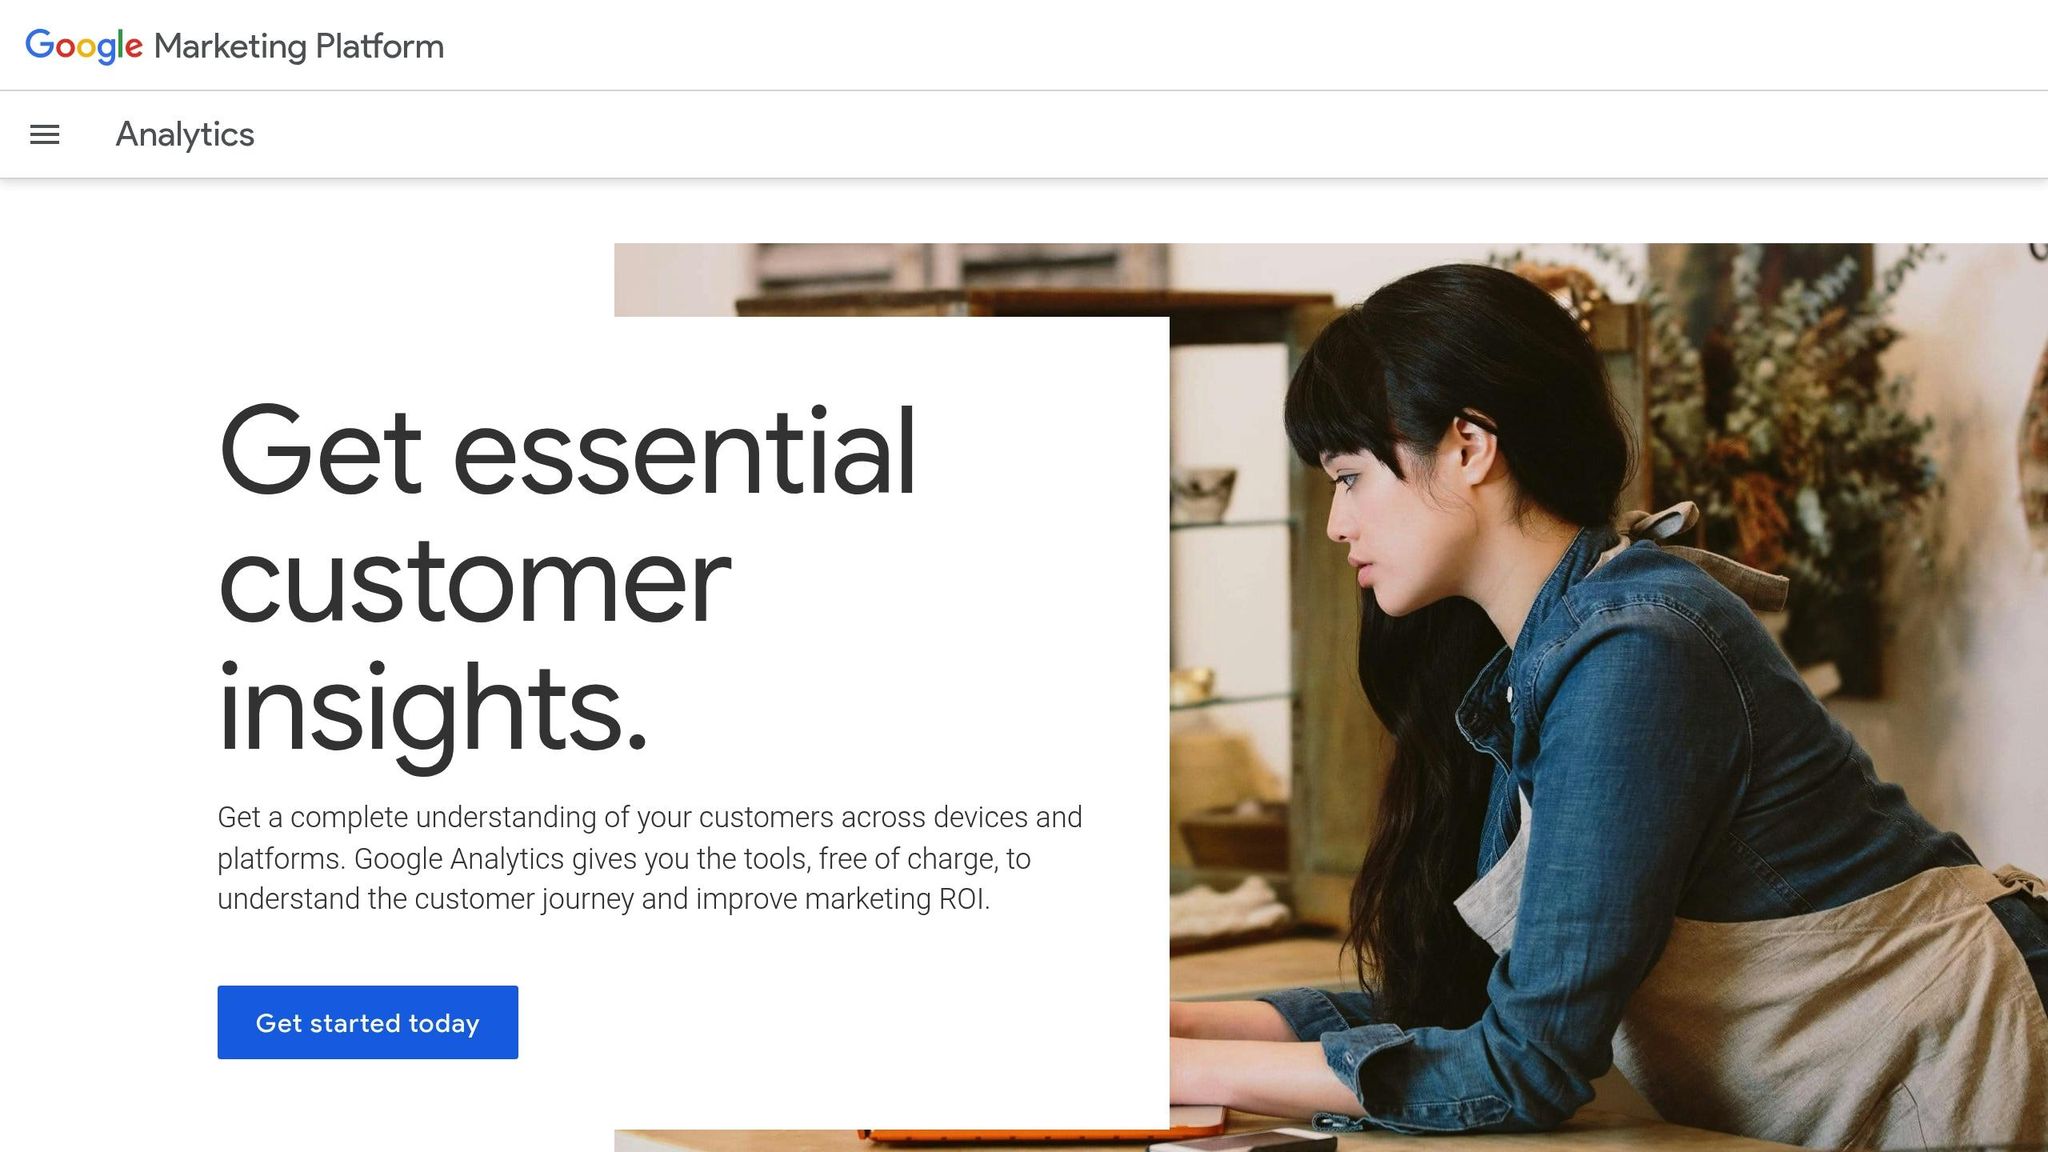
Shopify's built-in analytics is great for covering the basics, but if you want a deeper understanding of your customers' behavior, Google Analytics is the way to go. This free tool provides detailed insights like user journeys, event tracking, and funnel drop-offs - offering much more than just sales and traffic data.
With Google Analytics, you can see exactly how visitors interact with your store. It shows which pages they land on first, how long they stay, and where they decide to leave or make a purchase. These insights can help you pinpoint issues that might be costing you sales and uncover opportunities to improve the shopping experience. Let’s go over how to connect Google Analytics to your Shopify store.
Connecting Google Analytics to Shopify
To get started, you'll need to create a GA4 property and grab its Measurement ID. Head to analytics.google.com and log in with your Google account. Set up a new GA4 property for your Shopify store, and copy the Measurement ID - it’ll look something like "G-XXXXXXXXXX." If you’ve used a service like BuildMyStores (https://buildmystores.com) to create your Shopify store, you’ll find this integration is just as simple.
Next, go to your Shopify admin panel and navigate to Online Store > Preferences. Scroll down to the Google Analytics section, paste your Measurement ID into the appropriate field, and save your changes. Within about 24 hours, you’ll start seeing data in your Google Analytics dashboard. To confirm the setup, check the "Realtime" section in Google Analytics while browsing your store.
If you'd rather not handle the setup manually, apps like Analyzely can streamline the process for you.
For even more detailed insights, enable Enhanced eCommerce tracking. This feature tracks actions like product views, add-to-cart events, checkout steps, and completed purchases. To activate it, go to your GA4 property settings and turn on Enhanced measurement.
This integration gives you a clearer picture of customer behavior and complements Shopify's built-in analytics.
Tracking User Behavior and Conversion Goals
Google Analytics takes Shopify's basic analytics a step further by offering detailed insights into user actions and conversion paths. It transforms raw data into actionable information, tracking metrics like traffic sources, user navigation, session duration, and drop-off points in your sales funnel. This helps you understand not just what customers are doing, but why they’re doing it.
Conversion goals let you track specific actions you want customers to take, such as completing a purchase, signing up for a newsletter, or downloading a resource. By setting these goals, you can measure success beyond just sales and focus on smaller actions (micro-conversions) that often lead to future purchases.
To set up conversion goals in GA4, go to the "Configure" section and click on "Events." You can create goals based on destination URLs (like a thank-you page), event completions, or engagement metrics. For Shopify stores, common goals include reaching the checkout page, completing a purchase, or spending a certain amount of time on product pages.
Google Analytics also allows you to segment users by factors like demographics, traffic source, device type, location, and behavior. For example, you might notice that mobile users from social media convert less often than desktop users from organic search. This could signal the need to optimize your mobile checkout process or tweak your social media strategy.
Funnel visualization is another powerful feature, showing where customers drop off during the buying process. Combined with Enhanced eCommerce tracking, it provides detailed insights into product performance and checkout behavior.
Visual Behavior Analytics: Heatmaps and Session Recordings
Google Analytics delivers numbers, but tools like Hotjar and Crazy Egg go a step further by showing how customers actually interact with your store. These tools create visual representations of user behavior, uncovering patterns that traditional analytics might overlook. They don’t just tell you what customers are doing - they help you understand why.
Heatmaps and session recordings transform raw data into visual insights. Watching real user interactions can help you identify roadblocks and areas for improvement. This approach highlights usability issues and opportunities to improve the shopping experience. Together with numerical data, these visuals give you a clearer picture of customer behavior, making it easier to fine-tune your store.
According to industry research, stores that use heatmaps and session recordings have reported up to a 20% increase in conversion rates after making changes informed by these insights.
Reading Heatmaps and Click Patterns
Heatmaps use color coding to show where users are most active and which areas are being ignored. For Shopify stores, the main types of heatmaps include:
Click maps: These show where visitors click the most, helping you see which buttons, images, or links grab attention.
Scroll maps: These reveal how far users scroll down a page, ensuring that key content - like product details or calls to action - is located where it’s most visible.
Move maps: These track mouse movements, showing where users’ attention is focused.
One valuable takeaway is noticing when users repeatedly click on something that isn’t interactive. This can signal frustration or confusion.
In January 2023, a Shopify dropshipping store specializing in eco-friendly products used Hotjar heatmaps to discover that users weren’t engaging with the main product image. After repositioning the image to a more prominent spot, the store saw a 12% increase in product page conversions within two weeks (Hotjar Case Studies, 2023).
If click maps show low interaction with call-to-action buttons, consider adjusting their placement, color, or wording. Similarly, if users are clicking on non-interactive elements, it may be time to revise or rethink those areas.
Heatmaps can also reveal which parts of a product page - like images, reviews, or specifications - get the most attention. This insight helps you prioritize important content so that it appears above the fold.
Using Session Recordings to Find Problem Areas
Session recordings take things further by capturing individual user sessions, including mouse movements, clicks, scrolling, and navigation paths. Unlike heatmaps, which aggregate data, session recordings let you dive into specific customer journeys.
Pay special attention to recordings where users abandon their carts or leave without completing a purchase. Look for patterns like hesitation before clicking certain buttons, repeated attempts to find information, or sudden exits that might indicate frustration.
For example, session recordings often reveal common issues such as confusing navigation menus, unclear product options, or technical glitches during checkout. You might notice users repeatedly clicking on a broken link or scrolling back and forth while searching for shipping details.
In June 2022, a Shopify store selling fitness equipment used Crazy Egg session recordings to discover that customers were abandoning the checkout process due to a confusing shipping options layout. After simplifying the layout, the store reduced checkout abandonment by 18% (Crazy Egg, 2022).
When analyzing session recordings, focus on high-traffic pages and key conversion paths. Moments where users pause for an unusually long time can indicate confusion or difficulty making a decision. If multiple recordings highlight the same issue, that area should be a priority for improvement.
Don’t forget to review mobile session recordings as well. Mobile users often behave differently from desktop users - buttons might be too small, forms harder to fill out, or images may load too slowly on mobile devices.
Tool | Heatmaps | Session Recordings | Feedback Widgets | A/B Testing | Starting Price |
|---|---|---|---|---|---|
Hotjar | Yes | Yes | Yes | No | |
Crazy Egg | Yes | Yes | No | Yes | |
Google Analytics | Yes (basic) | Yes (basic) | No | No | Free |
By combining heatmaps and session recordings, you gain a detailed view of customer behavior that goes beyond just numbers. These tools help you refine layouts, improve content placement, and create a more seamless shopping experience.
For BuildMyStores users, integrating visual analytics tools is a simple way to continuously improve your Shopify store’s design and performance. When paired with demographic and segmentation data, these insights allow you to fine-tune every aspect of your store for better results.
Customer Segmentation and Behavior Patterns
Customer segmentation helps uncover specific behavior patterns within your audience. By dividing customers into smaller groups based on shared traits and behaviors, you can craft targeted marketing campaigns and improve retention. This approach builds on earlier analytics by providing deeper insights into what drives customer actions.
When done right, segmentation allows for personalized messaging that increases engagement and drives more conversions.
Creating Customer Segments
Effective segmentation starts with grouping customers based on key behaviors. For example, you can organize them by how often they make purchases, their product preferences, or how long it’s been since their last purchase. These groupings help you identify unique buying habits and trends.
Platforms like Shopify and Klaviyo make this process easier. Shopify analytics provides basic segmentation, while Klaviyo offers automated tools for more advanced groupings. These tools track purchase and browsing data, automatically updating customer groups as behaviors shift. For instance, you could label customers with more than two purchases in 90 days as loyal, while marking those inactive for over six months as at-risk. Useful data points for segmentation include:
Purchase history
Product categories bought
Engagement with email and SMS campaigns
Browsing activity, such as pages viewed or products added to the cart
Analyzing these metrics helps you identify high-value customers, repeat buyers, and those at risk of leaving. Once you’ve created your segments, you can compare them to identify areas where your strategies could improve.
Analyzing Behavior Trends Across Segments
Taking segmentation further involves analyzing trends within each group. This step transforms raw data into actionable strategies. For example, you can examine metrics like conversion rates, session duration, and cart abandonment rates for each segment. If first-time buyers show a high cart abandonment rate, it could highlight the need to simplify your checkout process.
According to Klaviyo, segmented email campaigns can achieve 2-3x higher open and click rates compared to non-segmented ones. Similarly, Shopify research shows that personalized campaigns based on behavioral segmentation can boost conversion rates by up to 20%.
For BuildMyStores users, implementing these strategies is seamless. The platform’s customizable Shopify stores integrate easily with tools like Klaviyo and Glew.io, making it simple to run targeted campaigns. The conversion-focused design of BuildMyStores ensures that each customer segment receives messaging tailored to their interests and buying habits.
Regularly reviewing the performance of your segments will help you spot new opportunities and fine-tune your marketing efforts to better meet the needs of different customer groups. This ongoing process ensures your strategies stay effective as customer behaviors evolve.
Turning Data Into Action Plans
Collecting data is just the beginning. The real challenge - and reward - comes from turning those numbers into actionable strategies that enhance your store's performance. This involves systematically identifying problems, prioritizing solutions, and tracking results to ensure meaningful improvements.
Translating raw data into customer-focused actions bridges the gap between analytics and real-world results. It’s this transformation that makes your data truly impactful.
Finding Areas to Improve
Start by analyzing your conversion funnels and using visual analytics to spot where customers drop off. Tools that highlight friction points can help you zero in on trouble areas. For example, pages with high bounce rates or short session durations are often prime candidates for improvement.
When prioritizing fixes, consider both the scope of the issue and its impact. A minor glitch affecting a small group of users might not need immediate attention, but a widespread issue - like mobile users struggling to complete a checkout - should be addressed right away. Patterns across customer segments can also provide insights. For instance, new visitors might face navigation challenges, while returning customers could be frustrated by slow-loading product pages.
Product pages are especially critical since they directly influence buying decisions. Pay attention to metrics like time spent on the page, scroll depth, and click-through rates on product images. If customers aren’t engaging with these elements, it may be time to rethink your page layout or design.
For checkout optimization, analyze each step of the funnel closely. If abandonment spikes during the shipping information stage, your forms might be too complicated. Similarly, if customers leave after seeing shipping costs, test different ways to present this information - like showing it earlier in the process or offering free shipping thresholds as an incentive.
While conversion-focused designs can address common issues, every audience is different. Use your specific data to guide customizations that align with your customers’ needs.
Testing and Measuring Changes
Once you’ve identified the key issues, the next step is to test and measure potential solutions. A/B testing is an effective way to evaluate changes. By comparing a control version (the current setup) with a variant (your proposed change), you can isolate the impact of individual adjustments and ensure they’re actually improving performance.
For example, if session recordings reveal that customers struggle to find the "Add to Cart" button, you could test a more noticeable color or different placement. Track not just click-through rates but also completion rates to confirm the change improves the entire purchase flow.
It’s essential to measure both short-term and long-term effects. A quick improvement might look promising initially but could have unintended consequences over time. Monitor key metrics like conversion rates, average order value, and bounce rates for an extended period to ensure lasting benefits.
Document every test you run along with its results. Keeping a detailed record of what was tested, when, and how it affected your metrics provides valuable insights for future decisions and prevents repeating unsuccessful experiments.
Start with small, high-impact changes. Adjustments like tweaking button colors or headline text are low-risk and easy to implement, while larger changes, such as overhauling your checkout process, can disrupt the customer experience if not thoroughly tested. Testing smaller updates first allows you to build momentum before tackling more complex projects.
Keep in mind that customer behavior isn’t static. Seasonal trends or evolving user preferences may require you to revisit your data regularly. Scheduling monthly reviews of key metrics ensures you stay proactive and uncover new opportunities for growth.
Conclusion
Understanding customer behavior isn’t just about collecting data - it’s about turning that data into actionable insights that drive growth. By embracing a well-rounded approach to analytics, you set the stage for uncovering every angle of how customers interact with your store.
An integrated analytics strategy is key. Tools like Shopify Analytics, Google Analytics, and visual platforms such as Hotjar each bring unique strengths to the table. Shopify Analytics provides a clear picture of sales and traffic trends, Google Analytics dives deep into user journeys, and visual tools reveal where customers may encounter obstacles. Together, these tools can lead to impressive results, such as double-digit improvements in conversion rates and customer lifetime value.
The numbers back it up: stores using advanced analytics tools report up to 20% higher conversion rates compared to those relying only on basic analytics. Why? Because a combination of tools offers a more complete understanding of customer behavior, enabling smarter decisions and better outcomes.
But customer behavior analysis isn’t a one-and-done task. Preferences evolve, seasonal trends shift, and marketing campaigns influence how customers engage with your store. To stay competitive, you need to treat this as an ongoing process. Regularly reviewing metrics, testing strategies, and refining your approach ensures your store keeps pace with your customers’ changing needs.
For BuildMyStores users, who start with fully customizable, AI-powered Shopify dropshipping stores, these insights can lead to immediate and scalable improvements. By identifying what clicks with your audience, you can grow efficiently while retaining full control of your store.
It’s no surprise that 78% of e-commerce businesses view customer behavior data as essential for personalizing campaigns and improving user experience. The businesses that thrive are the ones that consistently listen to their data - and act on it.
FAQs
How can customer segmentation help improve marketing strategies for my Shopify store?
Customer segmentation helps you break your audience into smaller, more manageable groups based on common traits like demographics, shopping behavior, or browsing patterns. By getting to know these segments better, you can craft marketing campaigns that feel more personalized and aligned with what each group is looking for.
For instance, you could focus on repeat buyers by offering them exclusive discounts to reward their loyalty. Or, you might engage first-time visitors with special welcome deals to make a strong first impression. This strategy doesn’t just enhance customer engagement - it also drives higher conversion rates, ensuring your marketing efforts deliver greater results.
How do Shopify’s built-in analytics compare to Google Analytics for understanding customer behavior?
Shopify’s built-in analytics is designed to deliver insights tailored specifically to your store. From tracking sales trends to evaluating product performance and customer activity, all this data is conveniently accessible right within your Shopify dashboard. It’s a straightforward way to keep tabs on your store’s operations and make adjustments as needed.
Google Analytics, however, takes things a step further by offering a more detailed look at customer behavior. It provides tools to analyze website traffic, user demographics, and even behavior flows across your entire site. For those looking to dive deep into customer journeys and purchasing habits, combining Shopify’s analytics with Google Analytics can give you a well-rounded, data-driven perspective.
How can heatmaps and session recordings reveal customer behavior insights for Shopify stores?
Heatmaps and session recordings offer a deeper look into customer behavior on your Shopify store, giving you more than just numbers. Heatmaps visually display areas of high engagement - whether it’s clicks, scrolls, or hovers - so you can see what grabs your visitors' attention. On the other hand, session recordings let you replay individual user journeys, showing exactly how people navigate your store. This helps you pinpoint pain points or obstacles that might be affecting their shopping experience.
By combining these tools, you can gain clear insights to refine your store’s layout, enhance the overall user experience, and focus on the changes that will have the biggest impact on conversions.
Related Blog Posts
Analyzing customer behavior is the key to improving your Shopify store’s performance. It helps you understand how visitors interact with your site, why they abandon carts, and what drives their purchases. By tracking metrics like traffic sources, session duration, and conversion funnels, you can identify problem areas and make data-driven improvements. Using tools like Shopify Analytics, Google Analytics, heatmaps, and session recordings, you can refine your store's design, optimize checkout processes, and create tailored marketing campaigns. Here’s how you can start:
Traffic Sources: Identify where visitors come from (organic search, ads, social media) and which channels convert best.
Session Duration & Bounce Rate: Measure engagement and spot pages that need better content or design.
Conversion Funnels: Track where users drop off in the buying process and simplify those steps.
Customer Lifetime Value (CLV): Understand how much revenue each customer brings over time to guide your marketing spend.
Heatmaps & Session Recordings: Visualize user interactions to find usability issues or areas for improvement.
Customer Segmentation: Group customers based on behavior (e.g., frequent buyers vs. at-risk customers) for targeted strategies.
Shopify Analytics 2025 Full Tutorial - Understand Your Data To Scale With Ease
Key Customer Behavior Metrics to Track
Tracking key customer behavior metrics can give you a clearer picture of what your customers are doing, why they’re doing it, and where there’s room for improvement.
Traffic Sources and User Navigation
Traffic sources reveal where your customers are coming from - whether it’s organic search, paid ads, social media, or referral links. This information helps pinpoint which marketing channels bring in engaged visitors who are more likely to convert. For instance, a high bounce rate from social media traffic might mean your ad messaging doesn’t align with the landing page. On the other hand, strong conversions from organic search suggest your SEO is effectively targeting the right audience.
User navigation paths show how visitors move through your store. They highlight which pages drive engagement, where users drop off, and which pages lead to purchases. For example, if many users leave after landing on a specific category page, it could mean the page needs clearer calls to action or better product organization.
Next, let’s dive into session duration and bounce rate to measure how well your site keeps visitors engaged.
Session Duration and Bounce Rate
Session duration measures how long visitors stay on your site, while bounce rate shows the percentage of users who leave after viewing just one page. Together, these metrics paint a picture of how engaging and relevant your content is. For Shopify stores, session durations typically range from 2 to 4 minutes, with longer sessions often tied to higher conversion rates. Bounce rates for e-commerce sites generally fall between 20% and 45%.
A high bounce rate isn’t always a bad thing - sometimes users find what they need right away. However, consistently high bounce rates on key pages often signal problems with relevance or user experience. For example, if a paid traffic landing page has a high bounce rate, testing new layouts, messaging, or calls to action can help improve performance.
Now, let’s look at conversion funnels and customer lifetime value to better understand revenue-generating behaviors.
Conversion Funnels and Customer Lifetime Value
Conversion funnels map out a visitor’s journey from their first click to completing a purchase. A typical funnel might include steps like homepage → product page → add to cart → checkout → purchase. By analyzing where visitors drop off at each stage, you can identify specific areas to improve. For example, many Shopify stores see conversion rates between 1.4% and 2.5%, with top performers exceeding 3%. High drop-off rates often point to issues like a complicated checkout process, unexpected shipping costs, or unclear product details.
Customer Lifetime Value (CLV) estimates the total revenue a customer is likely to generate over their relationship with your store. It’s calculated by multiplying the average purchase value, purchase frequency, and customer lifespan. For example, a customer who spends $50 per order, shops twice a year, and stays loyal for three years has a CLV of $300. Knowing your CLV can help you decide how much to invest in acquiring and retaining customers. After all, returning customers can contribute up to 40% of your store’s revenue.
Tracking these metrics gives you the insights needed to make smarter, data-driven decisions. Together, they provide a well-rounded view of how effectively your store engages visitors and turns them into loyal customers.
Using Shopify's Built-In Analytics
Shopify offers a built-in analytics dashboard that simplifies tracking customer behavior. With tools for monitoring real-time sales, traffic, sessions, and product views, it’s designed to be intuitive and accessible - even for those without technical expertise.
Accessing Shopify Analytics Dashboard
To get started, log in to your Shopify admin panel and select "Analytics" from the left sidebar. The dashboard is organized into three main sections: Overview, Reports, and Live View. These sections provide a clear snapshot of key metrics like product views, sessions, and conversion rates.
Overview: Displays essential metrics - total sales, sessions, and conversion rates - over a selected time period. Dates are shown in the MM/DD/YYYY format, and values are presented in U.S. dollars ($).
Reports: Offers deeper insights into customer behavior, sales attribution, and traffic sources.
Live View: Shows real-time data, including the number of visitors and ongoing sales.
For BuildMyStores users, conversion tracking is already optimized, so you can dive straight into analyzing your store’s performance.
Reading Customer Behavior Reports
Shopify's customer behavior reports focus on critical areas like product views, sessions, and abandoned carts, helping you understand how customers interact with your store.
Product Views: Identify which items are performing well and which might need adjustments, such as improved descriptions, better images, or competitive pricing.
Sessions: Track how visitors navigate your site and how long they stay. You can segment this data by customer type - first-time visitors versus returning customers - to refine your marketing strategies and retention efforts.
Abandoned Carts: This report is invaluable for spotting issues in the checkout process. For example, if cart abandonment increases after shipping costs are revealed, you might consider offering free shipping or displaying shipping details earlier. A spike at the payment stage could indicate problems with payment options or concerns about security.
These reports also highlight conversion trends by traffic source. For instance, you might discover that visitors from organic search convert more frequently than those from social media. Such insights can guide you in addressing specific problem areas.
Shopify formats all data for U.S. merchants, using commas for thousand separators, periods for decimals, and standard U.S. time zones for time-based reports. This consistent formatting makes it easier to align analytics data with your marketing efforts and overall business operations.
Setting Up Google Analytics for Better Tracking
Shopify's built-in analytics is great for covering the basics, but if you want a deeper understanding of your customers' behavior, Google Analytics is the way to go. This free tool provides detailed insights like user journeys, event tracking, and funnel drop-offs - offering much more than just sales and traffic data.
With Google Analytics, you can see exactly how visitors interact with your store. It shows which pages they land on first, how long they stay, and where they decide to leave or make a purchase. These insights can help you pinpoint issues that might be costing you sales and uncover opportunities to improve the shopping experience. Let’s go over how to connect Google Analytics to your Shopify store.
Connecting Google Analytics to Shopify
To get started, you'll need to create a GA4 property and grab its Measurement ID. Head to analytics.google.com and log in with your Google account. Set up a new GA4 property for your Shopify store, and copy the Measurement ID - it’ll look something like "G-XXXXXXXXXX." If you’ve used a service like BuildMyStores (https://buildmystores.com) to create your Shopify store, you’ll find this integration is just as simple.
Next, go to your Shopify admin panel and navigate to Online Store > Preferences. Scroll down to the Google Analytics section, paste your Measurement ID into the appropriate field, and save your changes. Within about 24 hours, you’ll start seeing data in your Google Analytics dashboard. To confirm the setup, check the "Realtime" section in Google Analytics while browsing your store.
If you'd rather not handle the setup manually, apps like Analyzely can streamline the process for you.
For even more detailed insights, enable Enhanced eCommerce tracking. This feature tracks actions like product views, add-to-cart events, checkout steps, and completed purchases. To activate it, go to your GA4 property settings and turn on Enhanced measurement.
This integration gives you a clearer picture of customer behavior and complements Shopify's built-in analytics.
Tracking User Behavior and Conversion Goals
Google Analytics takes Shopify's basic analytics a step further by offering detailed insights into user actions and conversion paths. It transforms raw data into actionable information, tracking metrics like traffic sources, user navigation, session duration, and drop-off points in your sales funnel. This helps you understand not just what customers are doing, but why they’re doing it.
Conversion goals let you track specific actions you want customers to take, such as completing a purchase, signing up for a newsletter, or downloading a resource. By setting these goals, you can measure success beyond just sales and focus on smaller actions (micro-conversions) that often lead to future purchases.
To set up conversion goals in GA4, go to the "Configure" section and click on "Events." You can create goals based on destination URLs (like a thank-you page), event completions, or engagement metrics. For Shopify stores, common goals include reaching the checkout page, completing a purchase, or spending a certain amount of time on product pages.
Google Analytics also allows you to segment users by factors like demographics, traffic source, device type, location, and behavior. For example, you might notice that mobile users from social media convert less often than desktop users from organic search. This could signal the need to optimize your mobile checkout process or tweak your social media strategy.
Funnel visualization is another powerful feature, showing where customers drop off during the buying process. Combined with Enhanced eCommerce tracking, it provides detailed insights into product performance and checkout behavior.
Visual Behavior Analytics: Heatmaps and Session Recordings
Google Analytics delivers numbers, but tools like Hotjar and Crazy Egg go a step further by showing how customers actually interact with your store. These tools create visual representations of user behavior, uncovering patterns that traditional analytics might overlook. They don’t just tell you what customers are doing - they help you understand why.
Heatmaps and session recordings transform raw data into visual insights. Watching real user interactions can help you identify roadblocks and areas for improvement. This approach highlights usability issues and opportunities to improve the shopping experience. Together with numerical data, these visuals give you a clearer picture of customer behavior, making it easier to fine-tune your store.
According to industry research, stores that use heatmaps and session recordings have reported up to a 20% increase in conversion rates after making changes informed by these insights.
Reading Heatmaps and Click Patterns
Heatmaps use color coding to show where users are most active and which areas are being ignored. For Shopify stores, the main types of heatmaps include:
Click maps: These show where visitors click the most, helping you see which buttons, images, or links grab attention.
Scroll maps: These reveal how far users scroll down a page, ensuring that key content - like product details or calls to action - is located where it’s most visible.
Move maps: These track mouse movements, showing where users’ attention is focused.
One valuable takeaway is noticing when users repeatedly click on something that isn’t interactive. This can signal frustration or confusion.
In January 2023, a Shopify dropshipping store specializing in eco-friendly products used Hotjar heatmaps to discover that users weren’t engaging with the main product image. After repositioning the image to a more prominent spot, the store saw a 12% increase in product page conversions within two weeks (Hotjar Case Studies, 2023).
If click maps show low interaction with call-to-action buttons, consider adjusting their placement, color, or wording. Similarly, if users are clicking on non-interactive elements, it may be time to revise or rethink those areas.
Heatmaps can also reveal which parts of a product page - like images, reviews, or specifications - get the most attention. This insight helps you prioritize important content so that it appears above the fold.
Using Session Recordings to Find Problem Areas
Session recordings take things further by capturing individual user sessions, including mouse movements, clicks, scrolling, and navigation paths. Unlike heatmaps, which aggregate data, session recordings let you dive into specific customer journeys.
Pay special attention to recordings where users abandon their carts or leave without completing a purchase. Look for patterns like hesitation before clicking certain buttons, repeated attempts to find information, or sudden exits that might indicate frustration.
For example, session recordings often reveal common issues such as confusing navigation menus, unclear product options, or technical glitches during checkout. You might notice users repeatedly clicking on a broken link or scrolling back and forth while searching for shipping details.
In June 2022, a Shopify store selling fitness equipment used Crazy Egg session recordings to discover that customers were abandoning the checkout process due to a confusing shipping options layout. After simplifying the layout, the store reduced checkout abandonment by 18% (Crazy Egg, 2022).
When analyzing session recordings, focus on high-traffic pages and key conversion paths. Moments where users pause for an unusually long time can indicate confusion or difficulty making a decision. If multiple recordings highlight the same issue, that area should be a priority for improvement.
Don’t forget to review mobile session recordings as well. Mobile users often behave differently from desktop users - buttons might be too small, forms harder to fill out, or images may load too slowly on mobile devices.
Tool | Heatmaps | Session Recordings | Feedback Widgets | A/B Testing | Starting Price |
|---|---|---|---|---|---|
Hotjar | Yes | Yes | Yes | No | |
Crazy Egg | Yes | Yes | No | Yes | |
Google Analytics | Yes (basic) | Yes (basic) | No | No | Free |
By combining heatmaps and session recordings, you gain a detailed view of customer behavior that goes beyond just numbers. These tools help you refine layouts, improve content placement, and create a more seamless shopping experience.
For BuildMyStores users, integrating visual analytics tools is a simple way to continuously improve your Shopify store’s design and performance. When paired with demographic and segmentation data, these insights allow you to fine-tune every aspect of your store for better results.
Customer Segmentation and Behavior Patterns
Customer segmentation helps uncover specific behavior patterns within your audience. By dividing customers into smaller groups based on shared traits and behaviors, you can craft targeted marketing campaigns and improve retention. This approach builds on earlier analytics by providing deeper insights into what drives customer actions.
When done right, segmentation allows for personalized messaging that increases engagement and drives more conversions.
Creating Customer Segments
Effective segmentation starts with grouping customers based on key behaviors. For example, you can organize them by how often they make purchases, their product preferences, or how long it’s been since their last purchase. These groupings help you identify unique buying habits and trends.
Platforms like Shopify and Klaviyo make this process easier. Shopify analytics provides basic segmentation, while Klaviyo offers automated tools for more advanced groupings. These tools track purchase and browsing data, automatically updating customer groups as behaviors shift. For instance, you could label customers with more than two purchases in 90 days as loyal, while marking those inactive for over six months as at-risk. Useful data points for segmentation include:
Purchase history
Product categories bought
Engagement with email and SMS campaigns
Browsing activity, such as pages viewed or products added to the cart
Analyzing these metrics helps you identify high-value customers, repeat buyers, and those at risk of leaving. Once you’ve created your segments, you can compare them to identify areas where your strategies could improve.
Analyzing Behavior Trends Across Segments
Taking segmentation further involves analyzing trends within each group. This step transforms raw data into actionable strategies. For example, you can examine metrics like conversion rates, session duration, and cart abandonment rates for each segment. If first-time buyers show a high cart abandonment rate, it could highlight the need to simplify your checkout process.
According to Klaviyo, segmented email campaigns can achieve 2-3x higher open and click rates compared to non-segmented ones. Similarly, Shopify research shows that personalized campaigns based on behavioral segmentation can boost conversion rates by up to 20%.
For BuildMyStores users, implementing these strategies is seamless. The platform’s customizable Shopify stores integrate easily with tools like Klaviyo and Glew.io, making it simple to run targeted campaigns. The conversion-focused design of BuildMyStores ensures that each customer segment receives messaging tailored to their interests and buying habits.
Regularly reviewing the performance of your segments will help you spot new opportunities and fine-tune your marketing efforts to better meet the needs of different customer groups. This ongoing process ensures your strategies stay effective as customer behaviors evolve.
Turning Data Into Action Plans
Collecting data is just the beginning. The real challenge - and reward - comes from turning those numbers into actionable strategies that enhance your store's performance. This involves systematically identifying problems, prioritizing solutions, and tracking results to ensure meaningful improvements.
Translating raw data into customer-focused actions bridges the gap between analytics and real-world results. It’s this transformation that makes your data truly impactful.
Finding Areas to Improve
Start by analyzing your conversion funnels and using visual analytics to spot where customers drop off. Tools that highlight friction points can help you zero in on trouble areas. For example, pages with high bounce rates or short session durations are often prime candidates for improvement.
When prioritizing fixes, consider both the scope of the issue and its impact. A minor glitch affecting a small group of users might not need immediate attention, but a widespread issue - like mobile users struggling to complete a checkout - should be addressed right away. Patterns across customer segments can also provide insights. For instance, new visitors might face navigation challenges, while returning customers could be frustrated by slow-loading product pages.
Product pages are especially critical since they directly influence buying decisions. Pay attention to metrics like time spent on the page, scroll depth, and click-through rates on product images. If customers aren’t engaging with these elements, it may be time to rethink your page layout or design.
For checkout optimization, analyze each step of the funnel closely. If abandonment spikes during the shipping information stage, your forms might be too complicated. Similarly, if customers leave after seeing shipping costs, test different ways to present this information - like showing it earlier in the process or offering free shipping thresholds as an incentive.
While conversion-focused designs can address common issues, every audience is different. Use your specific data to guide customizations that align with your customers’ needs.
Testing and Measuring Changes
Once you’ve identified the key issues, the next step is to test and measure potential solutions. A/B testing is an effective way to evaluate changes. By comparing a control version (the current setup) with a variant (your proposed change), you can isolate the impact of individual adjustments and ensure they’re actually improving performance.
For example, if session recordings reveal that customers struggle to find the "Add to Cart" button, you could test a more noticeable color or different placement. Track not just click-through rates but also completion rates to confirm the change improves the entire purchase flow.
It’s essential to measure both short-term and long-term effects. A quick improvement might look promising initially but could have unintended consequences over time. Monitor key metrics like conversion rates, average order value, and bounce rates for an extended period to ensure lasting benefits.
Document every test you run along with its results. Keeping a detailed record of what was tested, when, and how it affected your metrics provides valuable insights for future decisions and prevents repeating unsuccessful experiments.
Start with small, high-impact changes. Adjustments like tweaking button colors or headline text are low-risk and easy to implement, while larger changes, such as overhauling your checkout process, can disrupt the customer experience if not thoroughly tested. Testing smaller updates first allows you to build momentum before tackling more complex projects.
Keep in mind that customer behavior isn’t static. Seasonal trends or evolving user preferences may require you to revisit your data regularly. Scheduling monthly reviews of key metrics ensures you stay proactive and uncover new opportunities for growth.
Conclusion
Understanding customer behavior isn’t just about collecting data - it’s about turning that data into actionable insights that drive growth. By embracing a well-rounded approach to analytics, you set the stage for uncovering every angle of how customers interact with your store.
An integrated analytics strategy is key. Tools like Shopify Analytics, Google Analytics, and visual platforms such as Hotjar each bring unique strengths to the table. Shopify Analytics provides a clear picture of sales and traffic trends, Google Analytics dives deep into user journeys, and visual tools reveal where customers may encounter obstacles. Together, these tools can lead to impressive results, such as double-digit improvements in conversion rates and customer lifetime value.
The numbers back it up: stores using advanced analytics tools report up to 20% higher conversion rates compared to those relying only on basic analytics. Why? Because a combination of tools offers a more complete understanding of customer behavior, enabling smarter decisions and better outcomes.
But customer behavior analysis isn’t a one-and-done task. Preferences evolve, seasonal trends shift, and marketing campaigns influence how customers engage with your store. To stay competitive, you need to treat this as an ongoing process. Regularly reviewing metrics, testing strategies, and refining your approach ensures your store keeps pace with your customers’ changing needs.
For BuildMyStores users, who start with fully customizable, AI-powered Shopify dropshipping stores, these insights can lead to immediate and scalable improvements. By identifying what clicks with your audience, you can grow efficiently while retaining full control of your store.
It’s no surprise that 78% of e-commerce businesses view customer behavior data as essential for personalizing campaigns and improving user experience. The businesses that thrive are the ones that consistently listen to their data - and act on it.
FAQs
How can customer segmentation help improve marketing strategies for my Shopify store?
Customer segmentation helps you break your audience into smaller, more manageable groups based on common traits like demographics, shopping behavior, or browsing patterns. By getting to know these segments better, you can craft marketing campaigns that feel more personalized and aligned with what each group is looking for.
For instance, you could focus on repeat buyers by offering them exclusive discounts to reward their loyalty. Or, you might engage first-time visitors with special welcome deals to make a strong first impression. This strategy doesn’t just enhance customer engagement - it also drives higher conversion rates, ensuring your marketing efforts deliver greater results.
How do Shopify’s built-in analytics compare to Google Analytics for understanding customer behavior?
Shopify’s built-in analytics is designed to deliver insights tailored specifically to your store. From tracking sales trends to evaluating product performance and customer activity, all this data is conveniently accessible right within your Shopify dashboard. It’s a straightforward way to keep tabs on your store’s operations and make adjustments as needed.
Google Analytics, however, takes things a step further by offering a more detailed look at customer behavior. It provides tools to analyze website traffic, user demographics, and even behavior flows across your entire site. For those looking to dive deep into customer journeys and purchasing habits, combining Shopify’s analytics with Google Analytics can give you a well-rounded, data-driven perspective.
How can heatmaps and session recordings reveal customer behavior insights for Shopify stores?
Heatmaps and session recordings offer a deeper look into customer behavior on your Shopify store, giving you more than just numbers. Heatmaps visually display areas of high engagement - whether it’s clicks, scrolls, or hovers - so you can see what grabs your visitors' attention. On the other hand, session recordings let you replay individual user journeys, showing exactly how people navigate your store. This helps you pinpoint pain points or obstacles that might be affecting their shopping experience.
By combining these tools, you can gain clear insights to refine your store’s layout, enhance the overall user experience, and focus on the changes that will have the biggest impact on conversions.
Related Blog Posts
Get your store!
© 2025 BuildMyStores
© 2025 BuildMyStores