🎉 Start Shopify’s $1 Plan and We’ll pay you up to $3,600 just for starting! 💸 — Limited Time
Get Limited Time Offer 💰
Offer Details — Rewards require completing eligible third-party offers. Reward amounts vary from $30 to $3,600. Terms and eligibility restrictions apply.
🎉 Start Shopify’s $1 Plan and We’ll pay you up to $3,600 just for starting! 💸 — Limited Time
Get Limited Time Offer 💰
Offer Details — Rewards require completing eligible third-party offers. Reward amounts vary from $30 to $3,600. Terms and eligibility restrictions apply.
🎉 Start Shopify’s $1 Plan and We’ll pay you up to $3,600 just for starting! 💸 — Limited Time
Get Limited Time Offer 💰
Offer Details — Rewards require completing eligible third-party offers. Reward amounts vary from $30 to $3,600. Terms and eligibility restrictions apply.
Ecommerce Strategies
Top AI Heatmap Tools for Shopify
Top AI Heatmap Tools for Shopify

If I had to sum it up fast: pick the tool based on your store’s main problem. If you want revenue-level page data, I’d look at Heatmap.com. If I want checkout and form friction data, I’d look at Mouseflow or MIDA. If I want behavior data plus surveys, Hotjar fits. If I want heatmaps with live chat and co-browsing, Lucky Orange stands out.
Most Shopify stores don’t have a traffic problem. They have a page, mobile, or checkout problem they can’t explain with standard analytics alone. And with 70% to 80% of Shopify traffic coming from mobile, page-level behavior data matters a lot more than many store owners think.
Here’s the short version of what this comparison covers:
Lucky Orange: heatmaps, recordings, live chat, co-browsing, AI summaries
Heatmap.com: ties clicks and scrolls to revenue per session
Mouseflow: strong on friction scoring, forms, and checkout drop-off
Hotjar: best for behavior data plus surveys, feedback, and NPS
MIDA: Shopify-linked recordings, checkout tracking, and lower-cost paid plans
What I’d watch most:
Site speed impact: script weight and load time vary a lot
Mobile tracking: this is a must for Shopify
Checkout visibility: some tools need Shopify Plus or extra setup
Revenue linkage: not every heatmap tool ties behavior to sales
Session caps: lower tiers can run out fast during traffic spikes
Quick Comparison
Tool | Best for | Starting price | Main tradeoff |
|---|---|---|---|
Lucky Orange | Live support + behavior analysis | $19/month | Recording limits and heavier script |
Heatmap.com | Revenue-focused CRO | $117/month | Higher cost for smaller stores |
Mouseflow | Form and checkout friction | $31–$39/month | Manual setup and load-time hit |
Hotjar | Feedback and VoC research | ~$39/month | Heaviest script in this group |
MIDA | Shopify-native checkout analysis | $9.90/month | Lower-tier caps and shorter retention |
So if you’re deciding fast, I’d use this rule: revenue = Heatmap.com, friction = Mouseflow, feedback = Hotjar, live recovery = Lucky Orange, Shopify checkout focus = MIDA. The rest of the article breaks down where each one fits, what it does well, and where it falls short.
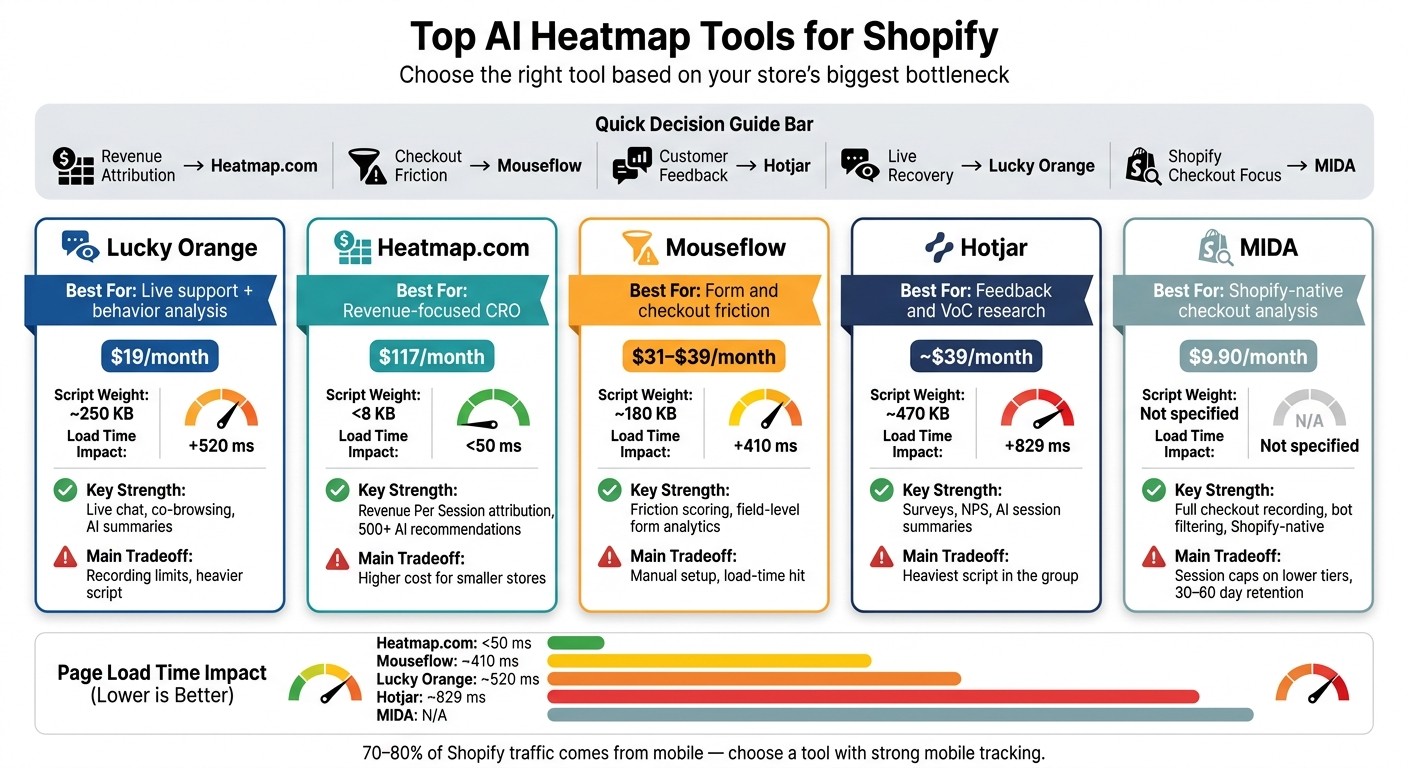
Top AI Heatmap Tools for Shopify: Side-by-Side Comparison
Quickly Grow Sales Using Lucky Orange Heatmaps & Replay - Shopify App Review By EcomExperts.io
1. Lucky Orange
Lucky Orange brings heatmaps, session recordings, form analytics, and live chat into one dashboard. For Shopify stores, the big draw is simple: it helps turn shopper behavior into steps you can act on.
AI Analysis
Lucky Orange’s Discovery AI lets you ask plain-English questions about your store data and points out conversion blockers. It also creates AI session summaries that tag visitor intent and frustration signals. On top of that, AI Referrals breaks out visits from AI search tools like ChatGPT, Claude, and Perplexity, which helps with traffic-source analysis for your store.
That matters most when you pair those signals with heatmaps and recordings. Data alone can hint at a problem. Seeing the clicks, scrolls, and hesitation shows what’s going on.
Heatmap and Replay Coverage
Lucky Orange includes click maps, scroll maps, and move maps. Its dynamic heatmaps track live elements like popups, overlays, expandable menus, and single-page apps without manual snapshots. That’s a big deal if your storefront changes on the fly.
Recordings use DVR-style playback, and Live View lets you watch visitors in real time. You can then jump in with live chat or co-browsing if someone seems stuck.
It also tracks mobile behavior with device-specific segmentation, which makes it easier to spot tap-target issues. One catch: recording stops once you hit your monthly session cap. So if your traffic swings a lot, it’s smarter to pick a plan based on peak traffic, not your monthly average.
Revenue and Funnel Analysis
Lucky Orange automatically tracks key Shopify events like "Product Viewed", "Added to Cart", and "Checkout Started". That gives you a clean starting point for building funnels around the steps that matter most.
If you spot a drop-off point, you can click into it and filter sessions from visitors who left at that exact step. That shortcut saves time. Instead of sifting through random recordings, you can go straight to the sessions tied to lost revenue.
Its form analytics go one layer deeper by breaking down individual fields, so you can see which inputs are causing abandonment. If shoppers keep stalling on one field, you’ll know where to look first.
Shopify Integration and Pricing
Lucky Orange is a Shopify Plus certified partner and offers one-click installation with no code changes required. The tracking script is about 250 KB and adds roughly 520 ms to load time. If you defer the script, that impact can drop to around 150 ms.
Pricing starts with a free plan for 100 sessions per month. Paid plans are $19, $39, $89, and $229 per month, while Discovery AI comes as an add-on. Annual billing cuts the cost by 20%.
For stores that want behavior analysis and shopper support in one place, Lucky Orange makes a strong all-in-one pick.
2. Heatmap.com
Heatmap.com puts the spotlight on revenue, not just behavior. Instead of stopping at clicks and scroll depth, it connects those actions to Shopify order data. So you can see which page elements are tied to sales. That makes its AI suggestions more useful than a standard click map.
AI Insight Depth
Its heatmapAI engine is trained on more than $4 billion in ecommerce revenue and produces 500+ recommendations for copy, layout, and imagery. It also auto-labels page elements with 88% accuracy, which means less manual setup work. On top of that, you can ask questions about behavior and revenue data inside Claude or ChatGPT.
That can lead to concrete wins. Obvi's CMO reports a 23% year-over-year lift after using the tool to spot elements that improve AOV.
Heatmap and Replay Coverage
Heatmap.com supports the main Shopify page types: homepages, collection pages, product detail pages, and cart pages. It tracks variant selections, image clicks, filter usage, and checkout interactions. Session replays can also be filtered by revenue, AOV, traffic source, and purchase status. If you want to review sessions tied to actual buying behavior, that saves a lot of digging.
Mobile tracking includes device-level interaction data for tap and scroll analysis. It also filters out bots, AI agents, and instant bounces.
Revenue and Funnel Analysis
Heatmap.com uses Revenue Per Session as its main lens instead of pageviews. That's a big shift. If pageviews tell you what people looked at, Revenue Per Session tells you what moved the needle.
Scrollmaps show revenue drop-off by section, which helps you spot where shoppers start to lose interest. Comparison Mode breaks out high- and low-AOV shoppers or traffic sources, so you can see which audiences convert best.
One catch: heatmapAI recommendations are limited to the top 3 pages on Pro plans.
Shopify Integration and Pricing
That deeper revenue angle comes with a higher starting price. Setup takes under two minutes through the Shopify App Store, and standard installs don't need code changes. The tracking script is under 8 kb and adds less than 50 ms to page load times. In a split test covering more than $2 million in revenue, the installed snippet showed no measurable change in site performance.
Pricing starts at $117/month for stores with $0–$4.9M ARR, and the 14-day free trial includes full features. There's also a basic free tier. For stores with fewer than 500 monthly visitors, though, the cost is tougher to justify.
Pros | Cons |
|---|---|
Connects clicks to revenue | Higher price than basic heatmap tools |
Quick no-code install | heatmapAI limited to top 3 pages on Pro plans |
Minimal speed impact | Less useful for stores under 500 monthly visitors |
Filters junk traffic automatically | Best suited to ecommerce teams, not general analytics users |
500+ revenue-based AI recommendations |
3. Mouseflow
Mouseflow has been in the checkout friction and form abandonment space since 2010, and more than 200,000 customers use it. Its big selling point is speed: it helps you find friction fast so you can jump into the right session recordings. For Shopify stores, that makes Mouseflow a strong option when checkout or form behavior needs a closer look.
AI Insight Depth
Mouseflow uses an AI agent called Mina to detect friction patterns on its own. It gives each session a Friction Score, so you can sort recordings by where shoppers seem most frustrated. It also creates a Friction Heatmap that shows where users hit errors or run into UI lag.
That focus matters. Mouseflow is stronger at UX friction than revenue attribution. It helps you spot friction and drop-off, but it does not give you direct revenue-per-click data.
Heatmap and Replay Coverage
Mouseflow includes several heatmap types:
Click
Scroll
Attention
Friction
Interactive
The Attention heatmap uses cursor movement as a rough stand-in for attention. In plain English, it helps you see where shoppers tend to focus on product and collection pages. You can also split heatmaps by mobile and desktop, which is useful because those two groups often behave very differently. Session replays can be filtered by friction score and custom tags.
Revenue and Funnel Analysis
For Shopify merchants, Mouseflow stands out most in checkout and form drop-off analysis. It tracks field-level drop-off, time spent on each field, and refill patterns. That can be handy for complex checkouts, subscription flows, and custom orders.
Its funnel analysis supports multi-step journeys and links straight to session recordings at drop-off points. So instead of only seeing where people leave, you can dig into why they leave.
Shopify Integration and Pricing
Setup is manual. You install Mouseflow by pasting its script into theme.liquid. Checkout tracking needs extra setup, and full checkout recording is usually limited to Shopify Plus.
There is a performance cost too. The script is about 180 KB and adds roughly 410 ms to page load time, with an estimated 3- to 8-point hit to Google PageSpeed scores.
Plan | Monthly Cost | Sessions | Data Retention |
|---|---|---|---|
Free | $0 | 500 | 1 month |
Starter | $31–$39 | 5,000 | 3 months |
Growth | $79–$109 | 15,000–25,000 | 6 months |
Business | $159–$319 | 50,000–100,000 | 12 months |
Pro | $299–$399 | 150,000 | Custom |
One thing to watch: seasonal traffic spikes can push you into a higher tier pretty fast. So if your main goal is friction analysis, Mouseflow makes sense. If you care more about tying behavior to revenue, it's less of a match.
4. Hotjar

Hotjar shifts the focus from spotting friction to understanding why shoppers behave the way they do. It adds AI summaries and voice-of-customer tools that help explain what’s happening on the page, not just where people click. On the Shopify App Store, it holds a 4.6/5 rating from 2,100+ reviews as of May 2026.
AI Insight Depth
Hotjar rolled out its AI features to Business-tier accounts in Q3 2025. The AI surfaces notable session patterns on its own, which saves time when you’re digging through a pile of recordings.
For example, Hotjar AI can auto-summarize session clusters like mobile users scrolling past the add-to-cart button or rage clicks near the size selector. Those summaries sit alongside Hotjar’s standard heatmaps and recordings, so you can move from a high-level pattern to the actual sessions behind it.
Heatmap and Replay Coverage
Hotjar includes click, scroll, and move heatmaps, along with session recordings that track activity across product pages, collections, and the cart. Its Trends dashboard, launched in early 2026, lets you track behavior changes over time.
Inside recordings, Hotjar automatically flags frustration signals like rage clicks and dead clicks. You can also segment heatmaps by device, which matters because mobile and desktop behavior often look nothing alike.
Hotjar also connects behavior with purchase events, which helps tie browsing patterns back to what shoppers did next.
Revenue and Funnel Analysis
Using Shopify order webhooks, Hotjar links sessions to purchase or abandonment events. It can also group survey responses into themes with AI, while its voice-of-customer tools - surveys, NPS widgets, and feedback prompts - add the missing context behind what heatmaps and recordings show.
That said, native revenue-per-click attribution is not built in out of the box. If you want that level of tracking, you’ll still need custom event setup.
Shopify Integration and Pricing
Hotjar can be installed through the Shopify App Store or by adding a script to theme.liquid. For Shopify Plus stores, it works with checkout extensibility and does not rely on deprecated workarounds.
The main downside is page speed. Hotjar’s script weighs about 470 KB and adds around 829 ms to page load time, which makes it the heaviest tool in this group. It can also lower PageSpeed scores by 5 to 15 points.
To limit the hit, load Hotjar only on the pages you’re actively reviewing and use a script deferral tool to help protect Core Web Vitals.
Plan | Monthly Cost | Daily Sessions | Key Features |
|---|---|---|---|
Observe Basic | Free | 35 | Unlimited heatmaps, 3 feedback widgets |
Observe Plus | ~$39/month | 100 | Session recordings, basic filtering |
Observe Business | ~$99/month | 500 | AI insights, revenue-aware funnels, custom events |
Observe Scale | $213+/month | Unlimited | Advanced features, priority support |
5. MIDA
MIDA is Shopify-native, which means it connects behavior data straight to orders, cart value, and customer profiles. This deep integration is essential for those using AI built Shopify stores to optimize conversion rates from day one. Put simply, it keeps the analysis inside Shopify, with orders, carts, and customer data linked to each session.
AI Insight Depth
MIDA's AI does more than point out surface-level trends. Its Relevance Score sorts recordings based on engagement, pageviews, and purchases, so you can spot high-intent visitors or frustrated users first. The AI Assistant suggests ways to fix friction points found in session data, while Replay Takeaways sum up each recording in plain English.
That Shopify-linked data also flows into its heatmaps and replays, which makes the findings easier to connect to revenue.
Heatmap and Replay Coverage
MIDA comes with standard heatmaps, plus a Conversion Heatmap that shows purchase rate and add-to-cart rate for individual page elements.
Session recordings follow the full path from landing page to checkout. You also get rage-click detection, inactivity skipping, playback speed control, and Advanced Record for checkout pages. On top of that, a bot blocker removes non-human traffic from the mix.
Revenue and Funnel Analysis
MIDA's Order Funnel follows the full Shopify purchase path. You can filter sessions by cart value, customer tag, or order ID.
This is where the tool gets especially useful for store owners. If add-to-cart rates look good but purchases fall behind, the issue often points to checkout friction, with shipping costs being a common cause.
Shopify Integration and Pricing
Setup is pretty simple, and checkout recording comes with every plan. MIDA connects through the Shopify Admin and needs the app embed turned on in your theme editor one time. If you change themes later, you'll need to turn it on again so tracking keeps working.
MIDA has a 4.9/5 rating from 479 Shopify App Store reviews.
Plan | Monthly Cost | Sessions/Month | Key Features |
|---|---|---|---|
Starter | Free | 300 | Live recordings, unlimited heatmaps, AI-powered summaries |
Basic | $9.90 | 5,000 | Bounce tracking, advanced filters, AI email reports |
Growth | $24.90 | 15,000 | Revenue click tracking, conversion heatmaps |
Enterprise | $44.90 | 40,000 | Checkout recordings, API export, bulk export |
AI Assistant add-on: +$5/month on Basic, +$10 on Growth, and +$15 on Enterprise. All paid plans include a 7-day free trial.
Retention usually runs 30 to 60 days, and recordings may fail during traffic spikes.
Pros, Cons, and Best-Fit Scenarios
Use the summary below to match each tool to the job it handles best.
Tool | Main Strengths | Notable Limitations | Best Workflow Fit |
|---|---|---|---|
Lucky Orange | Live chat, co-browsing, native Shopify app | Heavier script (~250KB, +520ms load time) | Real-time support & conversion recovery |
Heatmap.com | Revenue-per-session attribution, fast script (<50ms) | Starts at $117/mo; scales with ARR | Revenue-driven layout decisions |
Mouseflow | Field-level form analytics, friction scoring | Older interface; pricing scales with traffic | Form & checkout friction reduction |
Hotjar | Strong VoC tools | Heaviest script (~470KB, +829ms) | Voice of Customer research |
MIDA | Full checkout recording, bot filtering, Shopify-native | Session caps on lower tiers | Checkout funnel CRO |
One thing jumps out right away: speed matters. Hotjar has the heaviest load cost, while Heatmap.com is the lightest. If site performance is already a pain point, that difference can shape your choice fast.
The tools also split into pretty clear use cases. Lucky Orange leans into live support and recovery when shoppers are about to leave. Heatmap.com is built for teams that want to tie page behavior to revenue. Mouseflow is a strong pick when forms or checkout steps are leaking conversions. Hotjar fits best when you want direct customer input through VoC work. MIDA makes the most sense for Shopify brands that need a closer look at checkout behavior.
A simple way to use these tools: start with heatmaps to find friction, then test changes to see what helps. That keeps you from guessing based on clicks and scrolls alone.
The next section weighs each tool's tradeoffs side by side.
Conclusion
The right pick comes down to the job in front of you.
Heatmap.com is the best fit for revenue attribution. Hotjar works best for behavior data plus voice-of-customer research. Lucky Orange stands out when you want live support and analysis in the same workflow. Mouseflow is the best option for friction and form drop-off. MIDA fits stores that need Shopify-linked checkout analysis.
The smart move is simple: match the tool to your main bottleneck, then test changes against that same metric. Use heatmaps to spot the issue, recordings to verify it, and AI summaries to figure out what to test next.
Right now, the most useful AI features in this group are weekly store health reporting and natural-language analysis. For Shopify stores, the best AI heatmap tool is the one that lines up with your biggest friction point and gives you clear next steps.
FAQs
Which heatmap tool is best for small Shopify stores?
For small Shopify stores, Microsoft Clarity is a smart pick. It’s free, lightweight, and doesn’t cap sessions or lock away features.
If you want heatmaps plus customer support, Lucky Orange is a solid low-cost option. It also includes live chat, with plans starting at $10.00 per month.
BuildMyStores also offers free AI-built Shopify dropshipping stores. They’re customizable, built to drive conversions, and ready to sell.
Will a heatmap app slow down my Shopify store?
Yes, a heatmap app can slow down your Shopify store because it adds JavaScript to your storefront. How much it slows things down depends on the provider.
Some tools add measurable load time and can affect Core Web Vitals. Others reduce the hit by using asynchronous loading or Shopify theme app embeds to keep page speed issues lower. If speed matters - and it does - look for lightweight scripts or apps built to work natively with Shopify.
Do these tools track checkout behavior on Shopify?
Yes, many AI-powered heatmap tools for Shopify can track checkout behavior, but the feature set varies from one tool to another.
Some tools are built to record the full checkout flow, including interactions on payment pages. That gives you a closer look at where shoppers pause, hesitate, or drop off before finishing a purchase.
Others put more focus on checkout funnel events and cart activity instead of full page-level tracking. So before you choose a tool, check whether it specifically supports checkout tracking. That matters because some analytics platforms lose visibility once shoppers enter Shopify’s secure checkout.
Related Blog Posts
If I had to sum it up fast: pick the tool based on your store’s main problem. If you want revenue-level page data, I’d look at Heatmap.com. If I want checkout and form friction data, I’d look at Mouseflow or MIDA. If I want behavior data plus surveys, Hotjar fits. If I want heatmaps with live chat and co-browsing, Lucky Orange stands out.
Most Shopify stores don’t have a traffic problem. They have a page, mobile, or checkout problem they can’t explain with standard analytics alone. And with 70% to 80% of Shopify traffic coming from mobile, page-level behavior data matters a lot more than many store owners think.
Here’s the short version of what this comparison covers:
Lucky Orange: heatmaps, recordings, live chat, co-browsing, AI summaries
Heatmap.com: ties clicks and scrolls to revenue per session
Mouseflow: strong on friction scoring, forms, and checkout drop-off
Hotjar: best for behavior data plus surveys, feedback, and NPS
MIDA: Shopify-linked recordings, checkout tracking, and lower-cost paid plans
What I’d watch most:
Site speed impact: script weight and load time vary a lot
Mobile tracking: this is a must for Shopify
Checkout visibility: some tools need Shopify Plus or extra setup
Revenue linkage: not every heatmap tool ties behavior to sales
Session caps: lower tiers can run out fast during traffic spikes
Quick Comparison
Tool | Best for | Starting price | Main tradeoff |
|---|---|---|---|
Lucky Orange | Live support + behavior analysis | $19/month | Recording limits and heavier script |
Heatmap.com | Revenue-focused CRO | $117/month | Higher cost for smaller stores |
Mouseflow | Form and checkout friction | $31–$39/month | Manual setup and load-time hit |
Hotjar | Feedback and VoC research | ~$39/month | Heaviest script in this group |
MIDA | Shopify-native checkout analysis | $9.90/month | Lower-tier caps and shorter retention |
So if you’re deciding fast, I’d use this rule: revenue = Heatmap.com, friction = Mouseflow, feedback = Hotjar, live recovery = Lucky Orange, Shopify checkout focus = MIDA. The rest of the article breaks down where each one fits, what it does well, and where it falls short.
Top AI Heatmap Tools for Shopify: Side-by-Side Comparison
Quickly Grow Sales Using Lucky Orange Heatmaps & Replay - Shopify App Review By EcomExperts.io
1. Lucky Orange
Lucky Orange brings heatmaps, session recordings, form analytics, and live chat into one dashboard. For Shopify stores, the big draw is simple: it helps turn shopper behavior into steps you can act on.
AI Analysis
Lucky Orange’s Discovery AI lets you ask plain-English questions about your store data and points out conversion blockers. It also creates AI session summaries that tag visitor intent and frustration signals. On top of that, AI Referrals breaks out visits from AI search tools like ChatGPT, Claude, and Perplexity, which helps with traffic-source analysis for your store.
That matters most when you pair those signals with heatmaps and recordings. Data alone can hint at a problem. Seeing the clicks, scrolls, and hesitation shows what’s going on.
Heatmap and Replay Coverage
Lucky Orange includes click maps, scroll maps, and move maps. Its dynamic heatmaps track live elements like popups, overlays, expandable menus, and single-page apps without manual snapshots. That’s a big deal if your storefront changes on the fly.
Recordings use DVR-style playback, and Live View lets you watch visitors in real time. You can then jump in with live chat or co-browsing if someone seems stuck.
It also tracks mobile behavior with device-specific segmentation, which makes it easier to spot tap-target issues. One catch: recording stops once you hit your monthly session cap. So if your traffic swings a lot, it’s smarter to pick a plan based on peak traffic, not your monthly average.
Revenue and Funnel Analysis
Lucky Orange automatically tracks key Shopify events like "Product Viewed", "Added to Cart", and "Checkout Started". That gives you a clean starting point for building funnels around the steps that matter most.
If you spot a drop-off point, you can click into it and filter sessions from visitors who left at that exact step. That shortcut saves time. Instead of sifting through random recordings, you can go straight to the sessions tied to lost revenue.
Its form analytics go one layer deeper by breaking down individual fields, so you can see which inputs are causing abandonment. If shoppers keep stalling on one field, you’ll know where to look first.
Shopify Integration and Pricing
Lucky Orange is a Shopify Plus certified partner and offers one-click installation with no code changes required. The tracking script is about 250 KB and adds roughly 520 ms to load time. If you defer the script, that impact can drop to around 150 ms.
Pricing starts with a free plan for 100 sessions per month. Paid plans are $19, $39, $89, and $229 per month, while Discovery AI comes as an add-on. Annual billing cuts the cost by 20%.
For stores that want behavior analysis and shopper support in one place, Lucky Orange makes a strong all-in-one pick.
2. Heatmap.com
Heatmap.com puts the spotlight on revenue, not just behavior. Instead of stopping at clicks and scroll depth, it connects those actions to Shopify order data. So you can see which page elements are tied to sales. That makes its AI suggestions more useful than a standard click map.
AI Insight Depth
Its heatmapAI engine is trained on more than $4 billion in ecommerce revenue and produces 500+ recommendations for copy, layout, and imagery. It also auto-labels page elements with 88% accuracy, which means less manual setup work. On top of that, you can ask questions about behavior and revenue data inside Claude or ChatGPT.
That can lead to concrete wins. Obvi's CMO reports a 23% year-over-year lift after using the tool to spot elements that improve AOV.
Heatmap and Replay Coverage
Heatmap.com supports the main Shopify page types: homepages, collection pages, product detail pages, and cart pages. It tracks variant selections, image clicks, filter usage, and checkout interactions. Session replays can also be filtered by revenue, AOV, traffic source, and purchase status. If you want to review sessions tied to actual buying behavior, that saves a lot of digging.
Mobile tracking includes device-level interaction data for tap and scroll analysis. It also filters out bots, AI agents, and instant bounces.
Revenue and Funnel Analysis
Heatmap.com uses Revenue Per Session as its main lens instead of pageviews. That's a big shift. If pageviews tell you what people looked at, Revenue Per Session tells you what moved the needle.
Scrollmaps show revenue drop-off by section, which helps you spot where shoppers start to lose interest. Comparison Mode breaks out high- and low-AOV shoppers or traffic sources, so you can see which audiences convert best.
One catch: heatmapAI recommendations are limited to the top 3 pages on Pro plans.
Shopify Integration and Pricing
That deeper revenue angle comes with a higher starting price. Setup takes under two minutes through the Shopify App Store, and standard installs don't need code changes. The tracking script is under 8 kb and adds less than 50 ms to page load times. In a split test covering more than $2 million in revenue, the installed snippet showed no measurable change in site performance.
Pricing starts at $117/month for stores with $0–$4.9M ARR, and the 14-day free trial includes full features. There's also a basic free tier. For stores with fewer than 500 monthly visitors, though, the cost is tougher to justify.
Pros | Cons |
|---|---|
Connects clicks to revenue | Higher price than basic heatmap tools |
Quick no-code install | heatmapAI limited to top 3 pages on Pro plans |
Minimal speed impact | Less useful for stores under 500 monthly visitors |
Filters junk traffic automatically | Best suited to ecommerce teams, not general analytics users |
500+ revenue-based AI recommendations |
3. Mouseflow
Mouseflow has been in the checkout friction and form abandonment space since 2010, and more than 200,000 customers use it. Its big selling point is speed: it helps you find friction fast so you can jump into the right session recordings. For Shopify stores, that makes Mouseflow a strong option when checkout or form behavior needs a closer look.
AI Insight Depth
Mouseflow uses an AI agent called Mina to detect friction patterns on its own. It gives each session a Friction Score, so you can sort recordings by where shoppers seem most frustrated. It also creates a Friction Heatmap that shows where users hit errors or run into UI lag.
That focus matters. Mouseflow is stronger at UX friction than revenue attribution. It helps you spot friction and drop-off, but it does not give you direct revenue-per-click data.
Heatmap and Replay Coverage
Mouseflow includes several heatmap types:
Click
Scroll
Attention
Friction
Interactive
The Attention heatmap uses cursor movement as a rough stand-in for attention. In plain English, it helps you see where shoppers tend to focus on product and collection pages. You can also split heatmaps by mobile and desktop, which is useful because those two groups often behave very differently. Session replays can be filtered by friction score and custom tags.
Revenue and Funnel Analysis
For Shopify merchants, Mouseflow stands out most in checkout and form drop-off analysis. It tracks field-level drop-off, time spent on each field, and refill patterns. That can be handy for complex checkouts, subscription flows, and custom orders.
Its funnel analysis supports multi-step journeys and links straight to session recordings at drop-off points. So instead of only seeing where people leave, you can dig into why they leave.
Shopify Integration and Pricing
Setup is manual. You install Mouseflow by pasting its script into theme.liquid. Checkout tracking needs extra setup, and full checkout recording is usually limited to Shopify Plus.
There is a performance cost too. The script is about 180 KB and adds roughly 410 ms to page load time, with an estimated 3- to 8-point hit to Google PageSpeed scores.
Plan | Monthly Cost | Sessions | Data Retention |
|---|---|---|---|
Free | $0 | 500 | 1 month |
Starter | $31–$39 | 5,000 | 3 months |
Growth | $79–$109 | 15,000–25,000 | 6 months |
Business | $159–$319 | 50,000–100,000 | 12 months |
Pro | $299–$399 | 150,000 | Custom |
One thing to watch: seasonal traffic spikes can push you into a higher tier pretty fast. So if your main goal is friction analysis, Mouseflow makes sense. If you care more about tying behavior to revenue, it's less of a match.
4. Hotjar
Hotjar shifts the focus from spotting friction to understanding why shoppers behave the way they do. It adds AI summaries and voice-of-customer tools that help explain what’s happening on the page, not just where people click. On the Shopify App Store, it holds a 4.6/5 rating from 2,100+ reviews as of May 2026.
AI Insight Depth
Hotjar rolled out its AI features to Business-tier accounts in Q3 2025. The AI surfaces notable session patterns on its own, which saves time when you’re digging through a pile of recordings.
For example, Hotjar AI can auto-summarize session clusters like mobile users scrolling past the add-to-cart button or rage clicks near the size selector. Those summaries sit alongside Hotjar’s standard heatmaps and recordings, so you can move from a high-level pattern to the actual sessions behind it.
Heatmap and Replay Coverage
Hotjar includes click, scroll, and move heatmaps, along with session recordings that track activity across product pages, collections, and the cart. Its Trends dashboard, launched in early 2026, lets you track behavior changes over time.
Inside recordings, Hotjar automatically flags frustration signals like rage clicks and dead clicks. You can also segment heatmaps by device, which matters because mobile and desktop behavior often look nothing alike.
Hotjar also connects behavior with purchase events, which helps tie browsing patterns back to what shoppers did next.
Revenue and Funnel Analysis
Using Shopify order webhooks, Hotjar links sessions to purchase or abandonment events. It can also group survey responses into themes with AI, while its voice-of-customer tools - surveys, NPS widgets, and feedback prompts - add the missing context behind what heatmaps and recordings show.
That said, native revenue-per-click attribution is not built in out of the box. If you want that level of tracking, you’ll still need custom event setup.
Shopify Integration and Pricing
Hotjar can be installed through the Shopify App Store or by adding a script to theme.liquid. For Shopify Plus stores, it works with checkout extensibility and does not rely on deprecated workarounds.
The main downside is page speed. Hotjar’s script weighs about 470 KB and adds around 829 ms to page load time, which makes it the heaviest tool in this group. It can also lower PageSpeed scores by 5 to 15 points.
To limit the hit, load Hotjar only on the pages you’re actively reviewing and use a script deferral tool to help protect Core Web Vitals.
Plan | Monthly Cost | Daily Sessions | Key Features |
|---|---|---|---|
Observe Basic | Free | 35 | Unlimited heatmaps, 3 feedback widgets |
Observe Plus | ~$39/month | 100 | Session recordings, basic filtering |
Observe Business | ~$99/month | 500 | AI insights, revenue-aware funnels, custom events |
Observe Scale | $213+/month | Unlimited | Advanced features, priority support |
5. MIDA
MIDA is Shopify-native, which means it connects behavior data straight to orders, cart value, and customer profiles. This deep integration is essential for those using AI built Shopify stores to optimize conversion rates from day one. Put simply, it keeps the analysis inside Shopify, with orders, carts, and customer data linked to each session.
AI Insight Depth
MIDA's AI does more than point out surface-level trends. Its Relevance Score sorts recordings based on engagement, pageviews, and purchases, so you can spot high-intent visitors or frustrated users first. The AI Assistant suggests ways to fix friction points found in session data, while Replay Takeaways sum up each recording in plain English.
That Shopify-linked data also flows into its heatmaps and replays, which makes the findings easier to connect to revenue.
Heatmap and Replay Coverage
MIDA comes with standard heatmaps, plus a Conversion Heatmap that shows purchase rate and add-to-cart rate for individual page elements.
Session recordings follow the full path from landing page to checkout. You also get rage-click detection, inactivity skipping, playback speed control, and Advanced Record for checkout pages. On top of that, a bot blocker removes non-human traffic from the mix.
Revenue and Funnel Analysis
MIDA's Order Funnel follows the full Shopify purchase path. You can filter sessions by cart value, customer tag, or order ID.
This is where the tool gets especially useful for store owners. If add-to-cart rates look good but purchases fall behind, the issue often points to checkout friction, with shipping costs being a common cause.
Shopify Integration and Pricing
Setup is pretty simple, and checkout recording comes with every plan. MIDA connects through the Shopify Admin and needs the app embed turned on in your theme editor one time. If you change themes later, you'll need to turn it on again so tracking keeps working.
MIDA has a 4.9/5 rating from 479 Shopify App Store reviews.
Plan | Monthly Cost | Sessions/Month | Key Features |
|---|---|---|---|
Starter | Free | 300 | Live recordings, unlimited heatmaps, AI-powered summaries |
Basic | $9.90 | 5,000 | Bounce tracking, advanced filters, AI email reports |
Growth | $24.90 | 15,000 | Revenue click tracking, conversion heatmaps |
Enterprise | $44.90 | 40,000 | Checkout recordings, API export, bulk export |
AI Assistant add-on: +$5/month on Basic, +$10 on Growth, and +$15 on Enterprise. All paid plans include a 7-day free trial.
Retention usually runs 30 to 60 days, and recordings may fail during traffic spikes.
Pros, Cons, and Best-Fit Scenarios
Use the summary below to match each tool to the job it handles best.
Tool | Main Strengths | Notable Limitations | Best Workflow Fit |
|---|---|---|---|
Lucky Orange | Live chat, co-browsing, native Shopify app | Heavier script (~250KB, +520ms load time) | Real-time support & conversion recovery |
Heatmap.com | Revenue-per-session attribution, fast script (<50ms) | Starts at $117/mo; scales with ARR | Revenue-driven layout decisions |
Mouseflow | Field-level form analytics, friction scoring | Older interface; pricing scales with traffic | Form & checkout friction reduction |
Hotjar | Strong VoC tools | Heaviest script (~470KB, +829ms) | Voice of Customer research |
MIDA | Full checkout recording, bot filtering, Shopify-native | Session caps on lower tiers | Checkout funnel CRO |
One thing jumps out right away: speed matters. Hotjar has the heaviest load cost, while Heatmap.com is the lightest. If site performance is already a pain point, that difference can shape your choice fast.
The tools also split into pretty clear use cases. Lucky Orange leans into live support and recovery when shoppers are about to leave. Heatmap.com is built for teams that want to tie page behavior to revenue. Mouseflow is a strong pick when forms or checkout steps are leaking conversions. Hotjar fits best when you want direct customer input through VoC work. MIDA makes the most sense for Shopify brands that need a closer look at checkout behavior.
A simple way to use these tools: start with heatmaps to find friction, then test changes to see what helps. That keeps you from guessing based on clicks and scrolls alone.
The next section weighs each tool's tradeoffs side by side.
Conclusion
The right pick comes down to the job in front of you.
Heatmap.com is the best fit for revenue attribution. Hotjar works best for behavior data plus voice-of-customer research. Lucky Orange stands out when you want live support and analysis in the same workflow. Mouseflow is the best option for friction and form drop-off. MIDA fits stores that need Shopify-linked checkout analysis.
The smart move is simple: match the tool to your main bottleneck, then test changes against that same metric. Use heatmaps to spot the issue, recordings to verify it, and AI summaries to figure out what to test next.
Right now, the most useful AI features in this group are weekly store health reporting and natural-language analysis. For Shopify stores, the best AI heatmap tool is the one that lines up with your biggest friction point and gives you clear next steps.
FAQs
Which heatmap tool is best for small Shopify stores?
For small Shopify stores, Microsoft Clarity is a smart pick. It’s free, lightweight, and doesn’t cap sessions or lock away features.
If you want heatmaps plus customer support, Lucky Orange is a solid low-cost option. It also includes live chat, with plans starting at $10.00 per month.
BuildMyStores also offers free AI-built Shopify dropshipping stores. They’re customizable, built to drive conversions, and ready to sell.
Will a heatmap app slow down my Shopify store?
Yes, a heatmap app can slow down your Shopify store because it adds JavaScript to your storefront. How much it slows things down depends on the provider.
Some tools add measurable load time and can affect Core Web Vitals. Others reduce the hit by using asynchronous loading or Shopify theme app embeds to keep page speed issues lower. If speed matters - and it does - look for lightweight scripts or apps built to work natively with Shopify.
Do these tools track checkout behavior on Shopify?
Yes, many AI-powered heatmap tools for Shopify can track checkout behavior, but the feature set varies from one tool to another.
Some tools are built to record the full checkout flow, including interactions on payment pages. That gives you a closer look at where shoppers pause, hesitate, or drop off before finishing a purchase.
Others put more focus on checkout funnel events and cart activity instead of full page-level tracking. So before you choose a tool, check whether it specifically supports checkout tracking. That matters because some analytics platforms lose visibility once shoppers enter Shopify’s secure checkout.
Related Blog Posts
Get your store!
© 2025 BuildMyStores
© 2025 BuildMyStores