🎉 Start Shopify’s $1 Plan and We’ll pay you up to $3,600 just for starting! 💸 — Limited Time
Get Limited Time Offer 💰
Offer Details — Rewards require completing eligible third-party offers. Reward amounts vary from $30 to $3,600. Terms and eligibility restrictions apply.
🎉 Start Shopify’s $1 Plan and We’ll pay you up to $3,600 just for starting! 💸 — Limited Time
Get Limited Time Offer 💰
Offer Details — Rewards require completing eligible third-party offers. Reward amounts vary from $30 to $3,600. Terms and eligibility restrictions apply.
🎉 Start Shopify’s $1 Plan and We’ll pay you up to $3,600 just for starting! 💸 — Limited Time
Get Limited Time Offer 💰
Offer Details — Rewards require completing eligible third-party offers. Reward amounts vary from $30 to $3,600. Terms and eligibility restrictions apply.
Ecommerce Strategies
AI Demand Forecasting for Shopify Stock Risk
AI Demand Forecasting for Shopify Stock Risk

If I forecast demand better, I cut two of the biggest Shopify problems at once: stockouts and dead inventory. The article’s main point is simple: I can use clean SKU-level data, basic forecast methods or AI, and a few inventory formulas to decide what to reorder, when to reorder, and how much cash to put into stock.
Here’s the short version:
Start with clean data: daily units sold, SKU and variant data, stock on hand, returns, open POs, and supplier lead times.
Fix bad inputs first: remove false zero-sales days caused by stockouts, flag promo periods, and separate one-off bulk orders.
Match the model to the SKU: moving averages for steady items, smoothing for shifting demand, seasonal methods for repeat peaks, and AI when demand moves with promos, pricing, weather, or events.
Don’t confuse spikes with patterns: one influencer post is not the same as holiday demand that repeats each year.
Plan for new products with proxies: use similar products or parent-SKU sales until you have about 90 days of data.
Turn the forecast into buying rules: use lead-time demand, safety stock, and reorder points to lower risk.
Track results: watch MAPE, stockout rate, turnover, and service level so the forecast stays useful.
A few numbers stand out. The article notes that a 95% service level uses a 1.65 Z-score for safety stock, and gives a sample reorder point of 160 units for a SKU selling 40 units per week with a 3-week lead time and 40 units of safety stock. It also cites a 2026 study where AI forecasting cut safety stock by 19.4% and stockouts by 28.6%.
If I had to sum it up in one line, it would be this: good forecasting is not just about predicting sales; it’s about making better inventory calls with less guesswork.
Forthcast Inventory Management for Shopify merchants short demo

Build a Forecast Baseline From Clean Shopify Data
Forecasting starts with clean Shopify order and inventory data. If the inputs are messy, the forecast will be too. Start with four inputs: sales history, inventory, variants, and lead times.
The Right Data Inputs: Sales History, Inventory, Variants, and Lead Times
For SKU-level forecasting, the minimum dataset should come from Shopify plus your supplier records. At the center of it, you need units sold per day, order dates in MM/DD/YYYY format, end-of-day stock on hand, receipts and restock dates, and supplier lead times in days. Each order line should also include item-level revenue and any discount amount in USD so the forecast connects to cash flow planning.
Variant-level detail is a big deal. Parent-product averages can hide risk at the SKU level. A parent product may look steady overall while individual variants move in very different ways.
These fields make up the minimum forecasting dataset:
Data Category | Key Fields to Capture | Why It Matters |
|---|---|---|
Sales History | Units sold, order date (MM/DD/YYYY), sales channel (online store, POS, marketplace) | Builds the demand baseline and shows seasonality |
Inventory | Stock on hand (end of day), open purchase orders, inventory receipts | Shows current limits and stockout risk |
Variants | SKU, size, color, variant ID | Lets you forecast at the item level |
Logistics | Lead time in days, restock date, supplier ID | Turns demand into reorder timing |
Returns | Return date, quantity, reason, refund amount (USD) | Adjusts net demand so forecasts don't run high |
Remove Stockouts, Bulk Orders, and Promotion Distortion From Your Data
Raw Shopify exports almost always include periods that can throw off a model if you leave them untouched. A weak baseline leads straight to stockouts or too much inventory. Three issues do the most damage: stockout windows, one-time bulk orders, and promo spikes.
A stockout creates false zeroes. Demand didn't vanish. If a model learns that zero as normal demand, it will under-forecast and put you right back into the same stockout pattern. Mark those days as constrained demand and swap the zeroes for in-stock estimates. Web analytics can help. If product page views stayed high while checkouts dropped to zero, that's a strong signal that shoppers still wanted the item but inventory was gone.
Handle one-off bulk orders as outliers, not baseline demand. Flag them and remove them from the baseline. If B2B orders happen on a repeat basis, model that channel on its own. Promotions cause the same kind of distortion. Tag every promotion - flash sales, Black Friday, influencer drops - with a Promotion_Flag field so the model doesn't treat inflated demand as normal. Use net demand: gross sales minus returns and cancellations.
Why Unified Commerce Data Improves Forecast Accuracy
When Shopify, POS, and inventory records live in separate systems, forecasts miss stock movements and can double-count inventory. The most common problems are missed transfers between locations and reorder triggers firing at the wrong time because they're using only part of the sales history.
Make Shopify, or your inventory management app, the main record for on-hand stock. Then have all other systems read from and write to it through the API. A nightly reconciliation that syncs transactions across channels by SKU helps stop separate spreadsheets from drifting apart.
When product and order data connect into one structure from the start, inventory visibility, reorder timing, and cross-channel stock accuracy stay in shape as the catalog grows. It also makes scaling later much less painful.
With clean data in place, the next step is choosing the right forecast model.
Choose Forecast Models and Read Demand Patterns Correctly
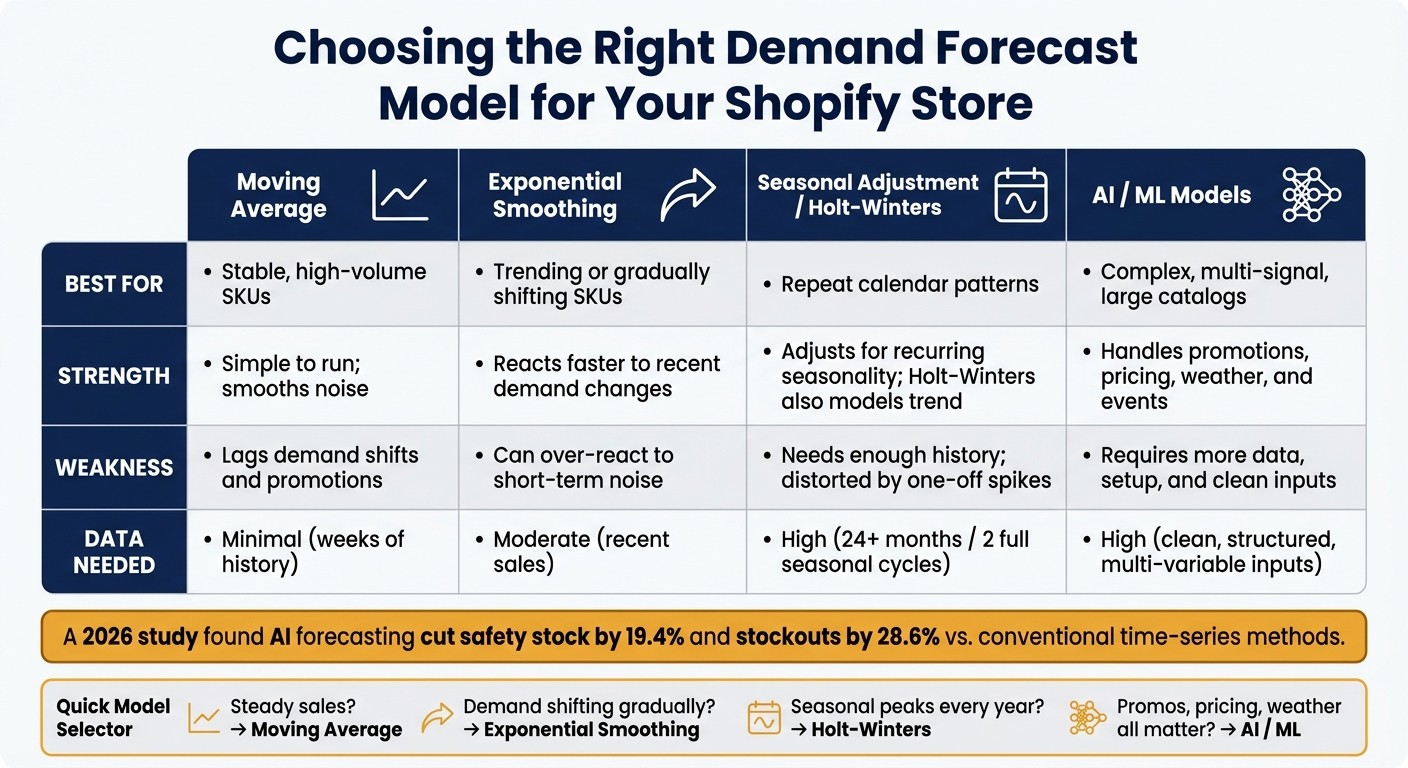
AI vs Traditional Forecasting: Inventory Models Compared
Pick the model that fits each SKU's demand stability, history length, and seasonality. If the fit is off, one SKU ends up overstocked while another runs out. Once your data is clean, start with the simplest model that matches the demand pattern.
Moving Average, Exponential Smoothing, Seasonal Indexing, and AI Models Compared
A simple moving average is the easiest starting point. It fits evergreen products with steady demand. The downside is simple: it gives every period the same weight, so it tends to lag when demand changes. If a product suddenly takes off or cools down, the forecast trails behind.
Exponential smoothing puts more weight on recent sales. That makes it a better fit for SKUs with demand that is slowly moving up or down, or for products affected by recent price or marketing changes. It reacts faster than a moving average, but it still struggles with strong seasonality.
For products with repeating calendar patterns, add seasonal adjustment to the baseline. When you have enough history, Holt-Winters triple exponential smoothing is the standard pick for seasonal SKUs because it models level, trend, and seasonality together. In most cases, you need at least two full seasonal cycles, or about 24 months of weekly data, for calibration you can trust.
Use AI models when demand depends on several signals at once, like promotions, price, ads, weather, or events, or when you're forecasting a large catalog. They aren't better by default, and they need clean, structured input data to work well.
Model | Best For | Strength | Weakness |
|---|---|---|---|
Moving Average | Stable, high-volume SKUs | Simple to run; smooths noise | Lags demand shifts and promotions |
Exponential Smoothing | Trending or gradually shifting SKUs | Reacts faster to recent demand changes | Can over-react to short-term noise |
Seasonal Adjustment / Holt-Winters | Repeat calendar patterns | Adjusts for recurring seasonality; Holt-Winters also models trend | Needs enough history and can be distorted by one-off spikes |
AI / ML Models | Complex, multi-signal, large catalogs | Handles promotions, pricing, weather, and events | Requires more data, setup, and clean inputs |
Model choice only works if you read trend and seasonality the right way.
How to Tell Trend Shifts Apart From True Seasonality
If you mistake a one-time spike for seasonality, you can end up ordering too much inventory every year at the same point on the calendar - and then watch it sit there.
True seasonality repeats. If a pattern shows up at about the same time and in about the same size across two or three straight years - Q4 gift demand, a late-August stationery spike, a summer swimwear surge - it points to seasonality. Check it with year-over-year comparisons and seasonal indices. If the index stays steady across several years, the pattern is probably real.
A trend shift is different. It's a lasting change in the demand level that doesn't snap back. If sales climb for six months and stay high, that's not seasonality. It's a change in market behavior, product positioning, or the customer base. Weekday-versus-weekend swings and monthly pay-cycle effects matter too. If you only look at monthly totals, those patterns can blur into what looks like random trend noise.
Short spikes, like one strong week from an influencer post or a flash sale, should be treated as noise or as a promo-driven effect. They shouldn't be baked into a seasonal model. If it didn't happen the year before and there's no clear reason it will happen again, leave it out.
When history is limited, stop hunting for patterns that aren't there and use proxies instead.
How to Forecast New Products and Low-History SKUs
New launches and recently added variants usually don't have enough sales history for time-series models to work well. The usual fix is to borrow the demand curve from a similar product: same category, similar price point, and close attributes. If you're launching a new colorway of a top-selling item, the parent product's sell-through rate is a solid starting point. If there isn't a close match, category-level averages can fill the gap.
For variant-level SKUs, use the parent product's pattern as the anchor while the variant builds its own history. Once a new SKU has at least 90 days of sales data, it's usually ready for a basic time-series model. Until then, keep the forecast window short.
Next, adjust the baseline for promotions and outside signals that can pull demand away from past patterns.
Factor In Promotions, External Signals, and Product Trends
Once your baseline is clean, add the forces that push demand away from past patterns. Sales history helps, but it can miss risk when demand moves fast. A discount code, an influencer post, or an early cold snap in October can send demand far above - or below - what the numbers from past periods suggest. AI forecasting works better when it has the why behind the shift, not just the sales record.
Measure Baseline Demand Versus Promotional Lift
Baseline demand is your normal, non-promotional sales. Promotional lift is the extra volume a campaign adds. The best way to forecast this is to split it into two layers: estimate normal demand first, then add a lift factor tied to the campaign type. You can learn that lift by campaign type from past promotions.
Tag every order in Shopify with the discount code, campaign ID, or referral channel tied to it. That gives AI models a way to treat promo periods as separate demand patterns by marking them with a promo_active variable, instead of mixing those spikes into the baseline trend. Also track the three to seven days before and after each promotion. Some customers buy right before a sale starts, while others wait a bit and purchase soon after it ends.
One more thing matters here: demand can get pulled forward from later periods. If you skip that, the dip after a promotion can look like demand fell off a cliff when it didn’t.
After promotions, the next job is to account for outside factors that shift demand too.
Add Weather, Events, Pricing, and Market Timing to Your Forecast
Weather swings can move demand hard in temperature-sensitive categories. If you sell in one of those categories, pull regional temperature data by ZIP code or state and feed it into the forecast along with order history.
Holiday timing and yearly buying cycles also drive clear spikes. Back-to-school runs from July through September. Black Friday and Cyber Monday push electronics and gifting. Tax refund season - roughly February through April - can lift discretionary spending on higher-ticket items. Shipping cutoff dates matter too. An order-by deadline for Christmas delivery often creates a rush right before the cutoff, then a steep drop right after. Build those dates into the forecast so you can plan a temporary stock increase instead of scrambling at the last minute. AI models can handle these patterns with features like days until Christmas or a back-to-school period flag, instead of leaning only on year-over-year sales.
Price changes matter at the SKU level. Log every move - regular price, markdown, and effective date - so the model can estimate demand elasticity and update the forecast before the new price goes live.
External Signal | Demand Impact | Planning Action |
|---|---|---|
Temperature swings | Regional, category-specific spikes | Adjust safety stock by region and season |
Holiday timing and annual events | Predictable annual surges | Add holiday and event flags |
Shipping cutoff dates | Sharp pre-cutoff surge, post-cutoff drop | Plan a temporary stock increase |
Pricing changes | Demand elasticity shifts | Log SKU-level price history; reforecast on planned changes |
Promotional campaigns | Short-term lift above baseline | Model separately; don't carry into baseline |
Use these signals to adjust reorder timing and safety stock, not just the forecast line.
Turn Forecasts Into Inventory Decisions and Scaling Plans
A forecast matters only when it changes what you buy.
The goal is simple: turn forecast data into clear buying rules. That means setting safety stock, reorder points, and reorder timing. From there, you can decide when to reorder, how much to buy, and which SKUs need closer attention.
Set Safety Stock, Reorder Points, and Purchase Timing
Start with the numbers your AI model gives you: average weekly demand, demand variability, and supplier lead time. Then turn those inputs into working thresholds.
Say a SKU sells 40 units per week and your supplier needs 3 weeks to deliver. Your lead-time demand is 120 units. Safety stock sits on top of that as a buffer. For a 95% service level, use a Z-score of 1.65. If that works out to 40 units of safety stock, your reorder point is 160 units: 120 + 40. Once your inventory position is expected to drop below that level during the lead-time window, it's time to place an order.
This is where AI helps. It keeps recalculating lead-time demand as sales patterns shift, seasonality kicks in, and supplier performance changes.
A 2026 study found that AI forecasting cut safety stock by 19.4% and stockouts by 28.6% compared with conventional time-series methods.
Forecast Output | Inventory Decision | Risk Mitigated |
|---|---|---|
Baseline demand per week | Purchase order quantity | Overstocking and tied-up cash |
Lead-time demand | Minimum stock before reordering | Stockouts during replenishment |
Demand variability | Safety stock level | Unexpected demand spikes |
Seasonality index | Temporary reorder point increase | Pre-peak shortfalls |
Forecast error trend | Buffer stock adjustment | Systematic over- or under-buying |
Track Forecast Accuracy With Error Rate, Stockout Rate, Turnover, and Service Level
Once your thresholds are in place, the next step is checking whether they hold up in day-to-day operations.
Four metrics tell you a lot:
Forecast error (MAPE): If it stays above 30%, the model is likely missing something. Maybe a new promotion pattern. Maybe a demand shift. Maybe a supplier change.
Stockout rate: This is the share of selling days when demand exists but inventory is zero. If core products are above 5% to 10%, your safety stock may be too thin or your forecasts may be too cautious.
Inventory turnover: This is annualized cost of goods sold divided by average inventory value in USD. If you move from 4x to 6x on a $200,000 average inventory position, you free up about $67,000 in working capital while keeping sales volume the same.
Service level: This is the share of demand filled without a stockout. For high-priority SKUs, aim for 95% to 98%.
A steady review rhythm keeps these numbers useful.
Weekly, scan for exceptions like surprise stockouts, big forecast misses, or sharp demand jumps. Then adjust purchase timing if needed. Monthly, review MAPE, stockout days, and turnover across your main SKUs. If the same items keep crossing thresholds, update your safety stock assumptions. Quarterly, step back and review bigger shifts: new SKUs, discontinued products, supplier reliability changes, and whether your seasonality patterns still match actual demand.
Scale Forecasting by SKU Velocity, Seasonality, and Profitability
Not every SKU deserves the same level of forecasting effort.
High-velocity, high-margin SKUs that drive most of your revenue should get tighter AI models, closer safety stock control, and higher service-level targets. A stockout on those items hurts the most.
Seasonal SKUs need different rules. Push reorder points higher before peak periods, then bring them down after the rush passes.
Low-velocity or low-margin items can run on simpler reorder rules based on broad demand estimates. That way, you don't sink too much time and money into analytics for products that add little profit.
As you grow into more warehouses or 3PLs, forecast by fulfillment node and include transfer lead times. Single-location rules start to fall apart when inventory is split across several points. Local demand patterns need their own reorder logic.
Apply these rules first to the SKUs that bring in the most revenue.
FAQs
How often should I update my demand forecast?
Update it on a regular basis. Stock levels might sync every 15 to 30 minutes, but your demand forecast should pull from real-time data so you can spot sales shifts and unusual activity as they happen.
Frequent AI-driven updates help keep your inventory plan in line with current customer behavior, seasonal spikes, and market demand.
Which Shopify SKUs need AI forecasting first?
Start with SKUs that have seasonal demand spikes, sharp sales swings, or an important role in multi-warehouse stock allocation. These are usually the products that gain the most from tighter inventory planning and fewer stockouts during peak periods.
It also makes sense to look at high-potential or trending products found through market research, so supply lines up more closely with demand.
How do I forecast demand when supplier lead times keep changing?
Use AI-powered inventory tools that pull in real-time supplier data. They look at past sales patterns, seasonal shifts, and supplier performance, including shipping speed and fulfillment reliability.
That gives you a clearer way to set benchmarks and create automated low-stock alerts that account for delivery delays. The result is better control over inventory risk and smarter purchasing decisions.
Related Blog Posts
If I forecast demand better, I cut two of the biggest Shopify problems at once: stockouts and dead inventory. The article’s main point is simple: I can use clean SKU-level data, basic forecast methods or AI, and a few inventory formulas to decide what to reorder, when to reorder, and how much cash to put into stock.
Here’s the short version:
Start with clean data: daily units sold, SKU and variant data, stock on hand, returns, open POs, and supplier lead times.
Fix bad inputs first: remove false zero-sales days caused by stockouts, flag promo periods, and separate one-off bulk orders.
Match the model to the SKU: moving averages for steady items, smoothing for shifting demand, seasonal methods for repeat peaks, and AI when demand moves with promos, pricing, weather, or events.
Don’t confuse spikes with patterns: one influencer post is not the same as holiday demand that repeats each year.
Plan for new products with proxies: use similar products or parent-SKU sales until you have about 90 days of data.
Turn the forecast into buying rules: use lead-time demand, safety stock, and reorder points to lower risk.
Track results: watch MAPE, stockout rate, turnover, and service level so the forecast stays useful.
A few numbers stand out. The article notes that a 95% service level uses a 1.65 Z-score for safety stock, and gives a sample reorder point of 160 units for a SKU selling 40 units per week with a 3-week lead time and 40 units of safety stock. It also cites a 2026 study where AI forecasting cut safety stock by 19.4% and stockouts by 28.6%.
If I had to sum it up in one line, it would be this: good forecasting is not just about predicting sales; it’s about making better inventory calls with less guesswork.
Forthcast Inventory Management for Shopify merchants short demo
Build a Forecast Baseline From Clean Shopify Data
Forecasting starts with clean Shopify order and inventory data. If the inputs are messy, the forecast will be too. Start with four inputs: sales history, inventory, variants, and lead times.
The Right Data Inputs: Sales History, Inventory, Variants, and Lead Times
For SKU-level forecasting, the minimum dataset should come from Shopify plus your supplier records. At the center of it, you need units sold per day, order dates in MM/DD/YYYY format, end-of-day stock on hand, receipts and restock dates, and supplier lead times in days. Each order line should also include item-level revenue and any discount amount in USD so the forecast connects to cash flow planning.
Variant-level detail is a big deal. Parent-product averages can hide risk at the SKU level. A parent product may look steady overall while individual variants move in very different ways.
These fields make up the minimum forecasting dataset:
Data Category | Key Fields to Capture | Why It Matters |
|---|---|---|
Sales History | Units sold, order date (MM/DD/YYYY), sales channel (online store, POS, marketplace) | Builds the demand baseline and shows seasonality |
Inventory | Stock on hand (end of day), open purchase orders, inventory receipts | Shows current limits and stockout risk |
Variants | SKU, size, color, variant ID | Lets you forecast at the item level |
Logistics | Lead time in days, restock date, supplier ID | Turns demand into reorder timing |
Returns | Return date, quantity, reason, refund amount (USD) | Adjusts net demand so forecasts don't run high |
Remove Stockouts, Bulk Orders, and Promotion Distortion From Your Data
Raw Shopify exports almost always include periods that can throw off a model if you leave them untouched. A weak baseline leads straight to stockouts or too much inventory. Three issues do the most damage: stockout windows, one-time bulk orders, and promo spikes.
A stockout creates false zeroes. Demand didn't vanish. If a model learns that zero as normal demand, it will under-forecast and put you right back into the same stockout pattern. Mark those days as constrained demand and swap the zeroes for in-stock estimates. Web analytics can help. If product page views stayed high while checkouts dropped to zero, that's a strong signal that shoppers still wanted the item but inventory was gone.
Handle one-off bulk orders as outliers, not baseline demand. Flag them and remove them from the baseline. If B2B orders happen on a repeat basis, model that channel on its own. Promotions cause the same kind of distortion. Tag every promotion - flash sales, Black Friday, influencer drops - with a Promotion_Flag field so the model doesn't treat inflated demand as normal. Use net demand: gross sales minus returns and cancellations.
Why Unified Commerce Data Improves Forecast Accuracy
When Shopify, POS, and inventory records live in separate systems, forecasts miss stock movements and can double-count inventory. The most common problems are missed transfers between locations and reorder triggers firing at the wrong time because they're using only part of the sales history.
Make Shopify, or your inventory management app, the main record for on-hand stock. Then have all other systems read from and write to it through the API. A nightly reconciliation that syncs transactions across channels by SKU helps stop separate spreadsheets from drifting apart.
When product and order data connect into one structure from the start, inventory visibility, reorder timing, and cross-channel stock accuracy stay in shape as the catalog grows. It also makes scaling later much less painful.
With clean data in place, the next step is choosing the right forecast model.
Choose Forecast Models and Read Demand Patterns Correctly
AI vs Traditional Forecasting: Inventory Models Compared
Pick the model that fits each SKU's demand stability, history length, and seasonality. If the fit is off, one SKU ends up overstocked while another runs out. Once your data is clean, start with the simplest model that matches the demand pattern.
Moving Average, Exponential Smoothing, Seasonal Indexing, and AI Models Compared
A simple moving average is the easiest starting point. It fits evergreen products with steady demand. The downside is simple: it gives every period the same weight, so it tends to lag when demand changes. If a product suddenly takes off or cools down, the forecast trails behind.
Exponential smoothing puts more weight on recent sales. That makes it a better fit for SKUs with demand that is slowly moving up or down, or for products affected by recent price or marketing changes. It reacts faster than a moving average, but it still struggles with strong seasonality.
For products with repeating calendar patterns, add seasonal adjustment to the baseline. When you have enough history, Holt-Winters triple exponential smoothing is the standard pick for seasonal SKUs because it models level, trend, and seasonality together. In most cases, you need at least two full seasonal cycles, or about 24 months of weekly data, for calibration you can trust.
Use AI models when demand depends on several signals at once, like promotions, price, ads, weather, or events, or when you're forecasting a large catalog. They aren't better by default, and they need clean, structured input data to work well.
Model | Best For | Strength | Weakness |
|---|---|---|---|
Moving Average | Stable, high-volume SKUs | Simple to run; smooths noise | Lags demand shifts and promotions |
Exponential Smoothing | Trending or gradually shifting SKUs | Reacts faster to recent demand changes | Can over-react to short-term noise |
Seasonal Adjustment / Holt-Winters | Repeat calendar patterns | Adjusts for recurring seasonality; Holt-Winters also models trend | Needs enough history and can be distorted by one-off spikes |
AI / ML Models | Complex, multi-signal, large catalogs | Handles promotions, pricing, weather, and events | Requires more data, setup, and clean inputs |
Model choice only works if you read trend and seasonality the right way.
How to Tell Trend Shifts Apart From True Seasonality
If you mistake a one-time spike for seasonality, you can end up ordering too much inventory every year at the same point on the calendar - and then watch it sit there.
True seasonality repeats. If a pattern shows up at about the same time and in about the same size across two or three straight years - Q4 gift demand, a late-August stationery spike, a summer swimwear surge - it points to seasonality. Check it with year-over-year comparisons and seasonal indices. If the index stays steady across several years, the pattern is probably real.
A trend shift is different. It's a lasting change in the demand level that doesn't snap back. If sales climb for six months and stay high, that's not seasonality. It's a change in market behavior, product positioning, or the customer base. Weekday-versus-weekend swings and monthly pay-cycle effects matter too. If you only look at monthly totals, those patterns can blur into what looks like random trend noise.
Short spikes, like one strong week from an influencer post or a flash sale, should be treated as noise or as a promo-driven effect. They shouldn't be baked into a seasonal model. If it didn't happen the year before and there's no clear reason it will happen again, leave it out.
When history is limited, stop hunting for patterns that aren't there and use proxies instead.
How to Forecast New Products and Low-History SKUs
New launches and recently added variants usually don't have enough sales history for time-series models to work well. The usual fix is to borrow the demand curve from a similar product: same category, similar price point, and close attributes. If you're launching a new colorway of a top-selling item, the parent product's sell-through rate is a solid starting point. If there isn't a close match, category-level averages can fill the gap.
For variant-level SKUs, use the parent product's pattern as the anchor while the variant builds its own history. Once a new SKU has at least 90 days of sales data, it's usually ready for a basic time-series model. Until then, keep the forecast window short.
Next, adjust the baseline for promotions and outside signals that can pull demand away from past patterns.
Factor In Promotions, External Signals, and Product Trends
Once your baseline is clean, add the forces that push demand away from past patterns. Sales history helps, but it can miss risk when demand moves fast. A discount code, an influencer post, or an early cold snap in October can send demand far above - or below - what the numbers from past periods suggest. AI forecasting works better when it has the why behind the shift, not just the sales record.
Measure Baseline Demand Versus Promotional Lift
Baseline demand is your normal, non-promotional sales. Promotional lift is the extra volume a campaign adds. The best way to forecast this is to split it into two layers: estimate normal demand first, then add a lift factor tied to the campaign type. You can learn that lift by campaign type from past promotions.
Tag every order in Shopify with the discount code, campaign ID, or referral channel tied to it. That gives AI models a way to treat promo periods as separate demand patterns by marking them with a promo_active variable, instead of mixing those spikes into the baseline trend. Also track the three to seven days before and after each promotion. Some customers buy right before a sale starts, while others wait a bit and purchase soon after it ends.
One more thing matters here: demand can get pulled forward from later periods. If you skip that, the dip after a promotion can look like demand fell off a cliff when it didn’t.
After promotions, the next job is to account for outside factors that shift demand too.
Add Weather, Events, Pricing, and Market Timing to Your Forecast
Weather swings can move demand hard in temperature-sensitive categories. If you sell in one of those categories, pull regional temperature data by ZIP code or state and feed it into the forecast along with order history.
Holiday timing and yearly buying cycles also drive clear spikes. Back-to-school runs from July through September. Black Friday and Cyber Monday push electronics and gifting. Tax refund season - roughly February through April - can lift discretionary spending on higher-ticket items. Shipping cutoff dates matter too. An order-by deadline for Christmas delivery often creates a rush right before the cutoff, then a steep drop right after. Build those dates into the forecast so you can plan a temporary stock increase instead of scrambling at the last minute. AI models can handle these patterns with features like days until Christmas or a back-to-school period flag, instead of leaning only on year-over-year sales.
Price changes matter at the SKU level. Log every move - regular price, markdown, and effective date - so the model can estimate demand elasticity and update the forecast before the new price goes live.
External Signal | Demand Impact | Planning Action |
|---|---|---|
Temperature swings | Regional, category-specific spikes | Adjust safety stock by region and season |
Holiday timing and annual events | Predictable annual surges | Add holiday and event flags |
Shipping cutoff dates | Sharp pre-cutoff surge, post-cutoff drop | Plan a temporary stock increase |
Pricing changes | Demand elasticity shifts | Log SKU-level price history; reforecast on planned changes |
Promotional campaigns | Short-term lift above baseline | Model separately; don't carry into baseline |
Use these signals to adjust reorder timing and safety stock, not just the forecast line.
Turn Forecasts Into Inventory Decisions and Scaling Plans
A forecast matters only when it changes what you buy.
The goal is simple: turn forecast data into clear buying rules. That means setting safety stock, reorder points, and reorder timing. From there, you can decide when to reorder, how much to buy, and which SKUs need closer attention.
Set Safety Stock, Reorder Points, and Purchase Timing
Start with the numbers your AI model gives you: average weekly demand, demand variability, and supplier lead time. Then turn those inputs into working thresholds.
Say a SKU sells 40 units per week and your supplier needs 3 weeks to deliver. Your lead-time demand is 120 units. Safety stock sits on top of that as a buffer. For a 95% service level, use a Z-score of 1.65. If that works out to 40 units of safety stock, your reorder point is 160 units: 120 + 40. Once your inventory position is expected to drop below that level during the lead-time window, it's time to place an order.
This is where AI helps. It keeps recalculating lead-time demand as sales patterns shift, seasonality kicks in, and supplier performance changes.
A 2026 study found that AI forecasting cut safety stock by 19.4% and stockouts by 28.6% compared with conventional time-series methods.
Forecast Output | Inventory Decision | Risk Mitigated |
|---|---|---|
Baseline demand per week | Purchase order quantity | Overstocking and tied-up cash |
Lead-time demand | Minimum stock before reordering | Stockouts during replenishment |
Demand variability | Safety stock level | Unexpected demand spikes |
Seasonality index | Temporary reorder point increase | Pre-peak shortfalls |
Forecast error trend | Buffer stock adjustment | Systematic over- or under-buying |
Track Forecast Accuracy With Error Rate, Stockout Rate, Turnover, and Service Level
Once your thresholds are in place, the next step is checking whether they hold up in day-to-day operations.
Four metrics tell you a lot:
Forecast error (MAPE): If it stays above 30%, the model is likely missing something. Maybe a new promotion pattern. Maybe a demand shift. Maybe a supplier change.
Stockout rate: This is the share of selling days when demand exists but inventory is zero. If core products are above 5% to 10%, your safety stock may be too thin or your forecasts may be too cautious.
Inventory turnover: This is annualized cost of goods sold divided by average inventory value in USD. If you move from 4x to 6x on a $200,000 average inventory position, you free up about $67,000 in working capital while keeping sales volume the same.
Service level: This is the share of demand filled without a stockout. For high-priority SKUs, aim for 95% to 98%.
A steady review rhythm keeps these numbers useful.
Weekly, scan for exceptions like surprise stockouts, big forecast misses, or sharp demand jumps. Then adjust purchase timing if needed. Monthly, review MAPE, stockout days, and turnover across your main SKUs. If the same items keep crossing thresholds, update your safety stock assumptions. Quarterly, step back and review bigger shifts: new SKUs, discontinued products, supplier reliability changes, and whether your seasonality patterns still match actual demand.
Scale Forecasting by SKU Velocity, Seasonality, and Profitability
Not every SKU deserves the same level of forecasting effort.
High-velocity, high-margin SKUs that drive most of your revenue should get tighter AI models, closer safety stock control, and higher service-level targets. A stockout on those items hurts the most.
Seasonal SKUs need different rules. Push reorder points higher before peak periods, then bring them down after the rush passes.
Low-velocity or low-margin items can run on simpler reorder rules based on broad demand estimates. That way, you don't sink too much time and money into analytics for products that add little profit.
As you grow into more warehouses or 3PLs, forecast by fulfillment node and include transfer lead times. Single-location rules start to fall apart when inventory is split across several points. Local demand patterns need their own reorder logic.
Apply these rules first to the SKUs that bring in the most revenue.
FAQs
How often should I update my demand forecast?
Update it on a regular basis. Stock levels might sync every 15 to 30 minutes, but your demand forecast should pull from real-time data so you can spot sales shifts and unusual activity as they happen.
Frequent AI-driven updates help keep your inventory plan in line with current customer behavior, seasonal spikes, and market demand.
Which Shopify SKUs need AI forecasting first?
Start with SKUs that have seasonal demand spikes, sharp sales swings, or an important role in multi-warehouse stock allocation. These are usually the products that gain the most from tighter inventory planning and fewer stockouts during peak periods.
It also makes sense to look at high-potential or trending products found through market research, so supply lines up more closely with demand.
How do I forecast demand when supplier lead times keep changing?
Use AI-powered inventory tools that pull in real-time supplier data. They look at past sales patterns, seasonal shifts, and supplier performance, including shipping speed and fulfillment reliability.
That gives you a clearer way to set benchmarks and create automated low-stock alerts that account for delivery delays. The result is better control over inventory risk and smarter purchasing decisions.
Related Blog Posts
Get your store!
© 2025 BuildMyStores
© 2025 BuildMyStores